
- Details
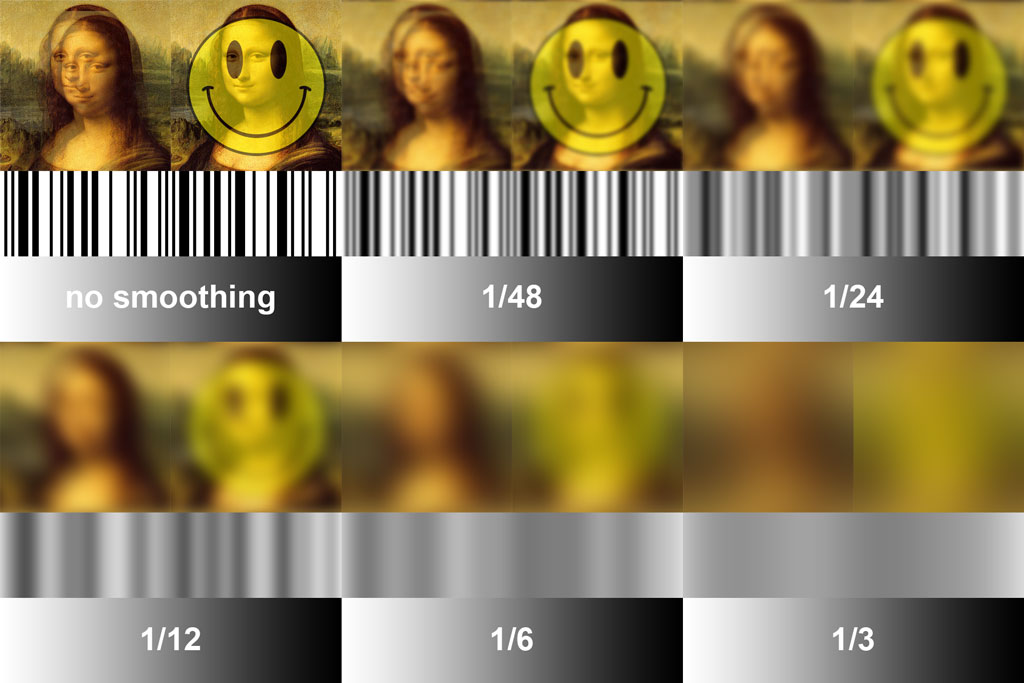 "Smoothing is essentially another type of averaging that is available only for Transfer Function displays (Phase or Magnitude). This feature helps to reduce "jagginess" on transfer function traces and can make trends in the frequency response of the system under test easier to see. On a smoothed transfer function trace, each data point is averaged together with some number of the immediately adjacent points on either side."1
Find out how this post-processing feature alters accurate data and provides a misleading frequency response or trend.
- Details
 Window size is the amount of time over which a waveform is sampled, known as time record, expressed in samples. For example, a window size of 128 samples at a sample rate of 48 kHz. Equals a time record of 128 samples x 1/48000 seconds = 0,0027 seconds or 2,7 milliseconds.
So how does this determine frequency resolution?
- Details
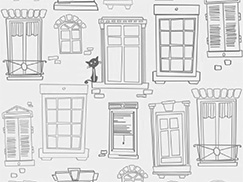
Bob McCarthy talks about understanding phase. Using a series of easy to understand diagrams Bob teaches how to read phase responses.
- Details
An excellent video by Monty Montgomery @ xiph.org, clearing up some very common misconceptions about digital audio.
- Details
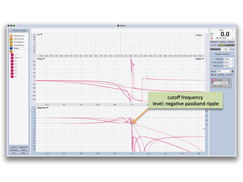 For those who are interested in filters, specifically crossover filters, there's a way to visualize filter behavior and interaction (both amplitude and phase) with nothing but your Apple computer and Smaart v.7.