
 "Smoothing is essentially another type of averaging that is available only for Transfer Function displays (Phase or Magnitude). This feature helps to reduce "jagginess" on transfer function traces and can make trends in the frequency response of the system under test easier to see. On a smoothed transfer function trace, each data point is averaged together with some number of the immediately adjacent points on either side."1
Find out how this post-processing feature alters accurate data and provides a misleading frequency response or trend.
Do we need smoothing and where does this "jaggedness" or "grass" come from? In real life every measurement is contaminated with reflections, arrivals from other sources or both. These signals irrevocably cause comb filters.
The depth and width of the "teeth" are determined by relative level and timing. The latter is frequency-dependent, in other words the same amount of delay causes different widths of gaps for different frequencies. The delay expressed as a number of, frequency dependent, wavelengths determines the width of the "teeth. As the number of wavelengths increase the "teeth" narrow. Factor in higher order reflections (reflections of reflections) and you'll have a fair amount of signals arriving one to numerous wavelengths late at varying levels. The result is an increasingly jagged result as frequency rises.
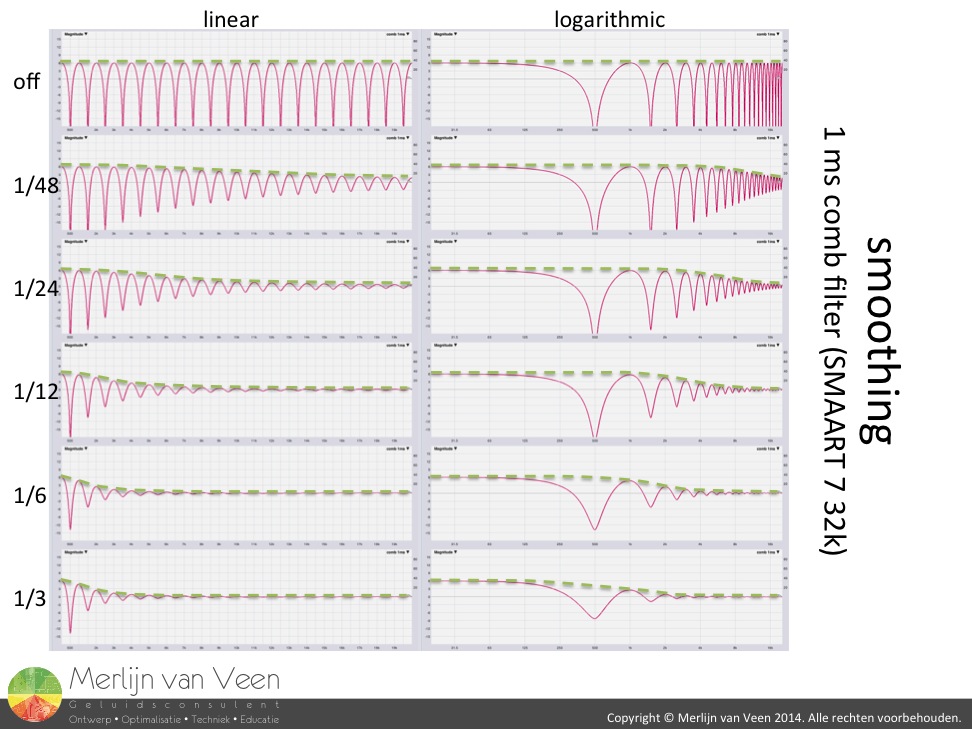 The image to the right shows a 1 ms comb filter at 1,5 Hz resolution (32k window size @ 48 kHz, 683 ms time record) on a linear and logarithmic frequency scale. A scenario that would occur in a regular stereo setup at the microphone membrane when it's positioned 34 cm closer to either the left or right speaker.
The linear view clearly shows where the comb filter got its name from. The logarithmic view on the other hand, which most of us use in real life, shows a narrowing of the "teeth" or increase in "jaggedness" as frequency rises. The difference in level between the peaks and dips is referred to as ripple2.
If we agree that the tonal character is indicated by the imaginary "eyeball" line or envelope over the peaks/survivors (the dotted green line), then smoothing would suggest an attenuation of the higher frequencies. Also notice a decrease in ripple which would suggest a difference in relative level. After all, only when both signals are equal in level, summation and cancellation are at a maximum ergo maximum ripple.
As smoothing is increased, "apparent" attenuation shifts towards lower frequencies and ripple is reduced even further. Should one act on these measurements and boost the affected region by means of equalization, the speaker or system would most likely sound overly bright.
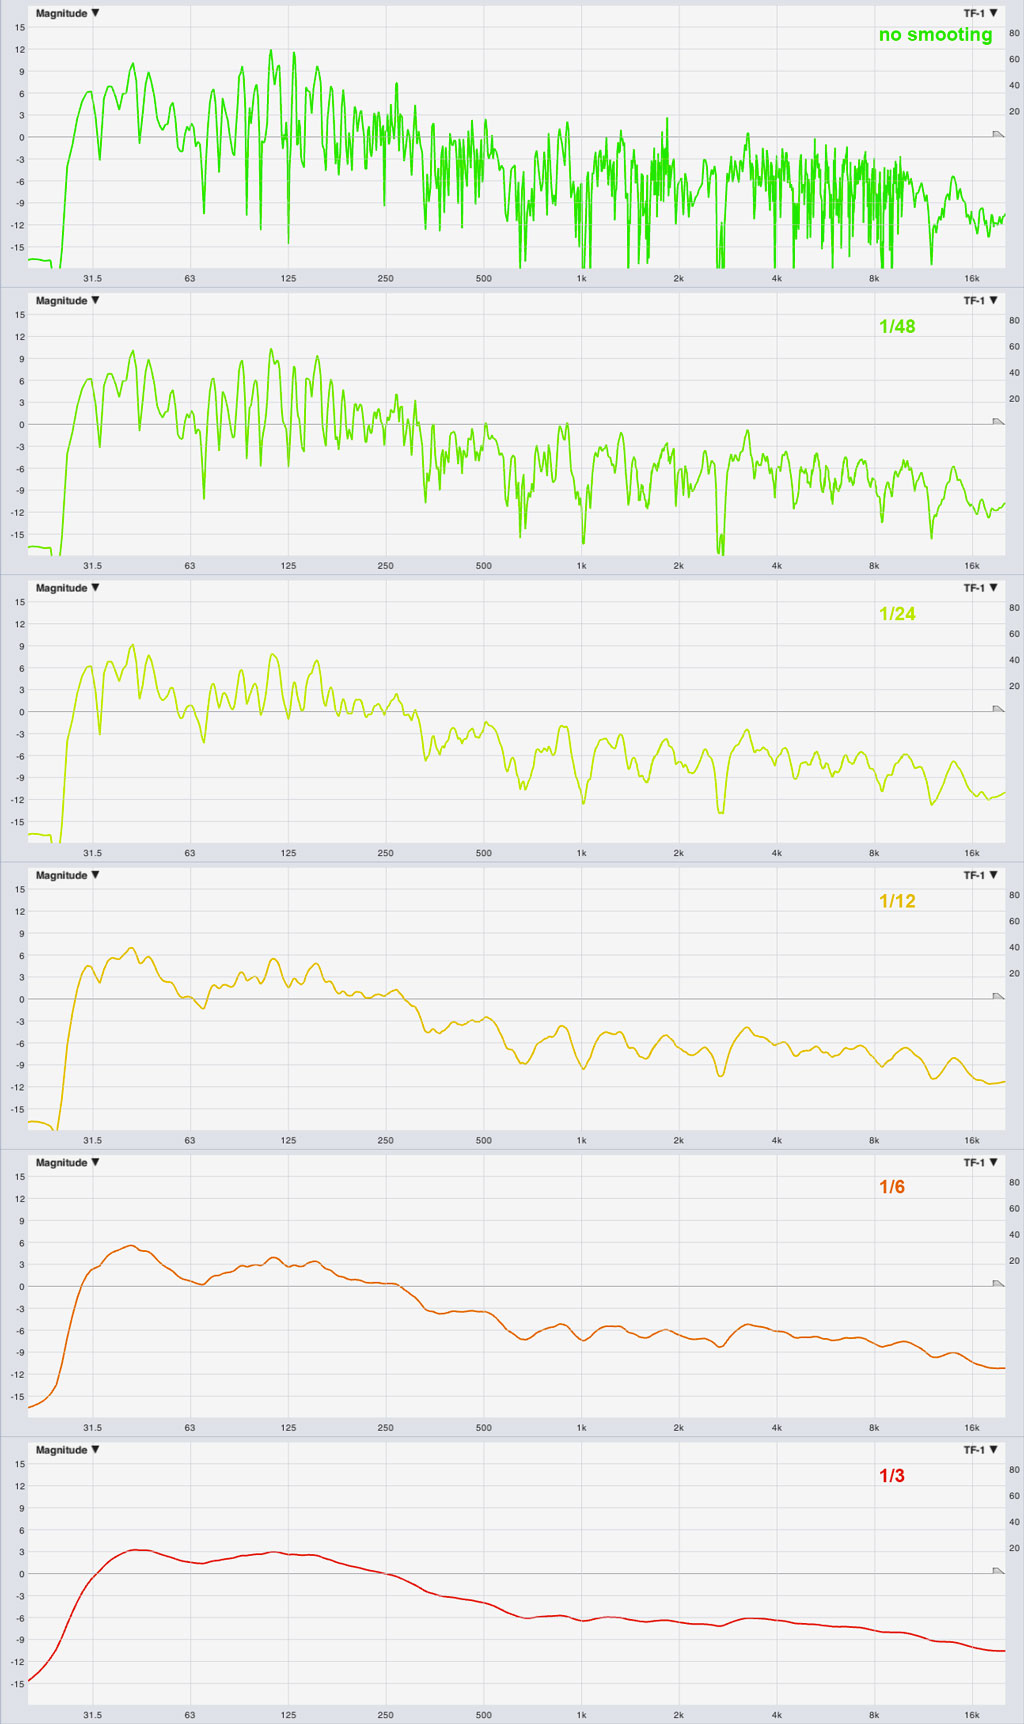 The image to the left shows a real speaker with increased smoothing. Notice an "apparent" change of tonality, level and a reduction in ripple.
In order to better see the differences lets concentrate on two smoothing settings at a time.
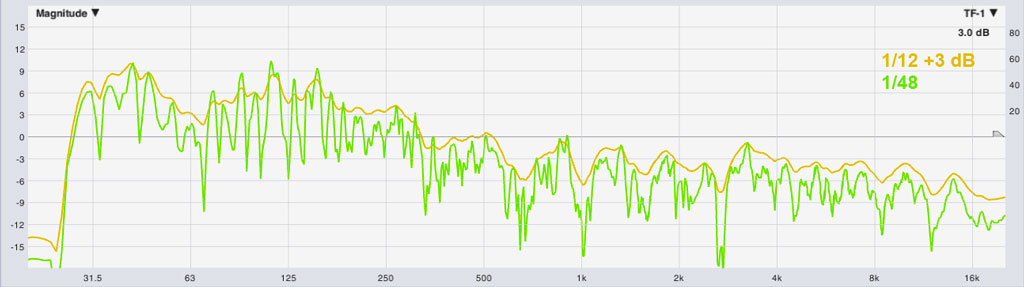 The 1/12 8ve smoothed trace required a two dB offset for best fit envelope of the 1/48 8ve smoothed trace. It's a reasonable fit but there are approx. 2 dB discrepancies in the 63 Hz, 125 Hz, 4 kHz and 8 kHz octaves.
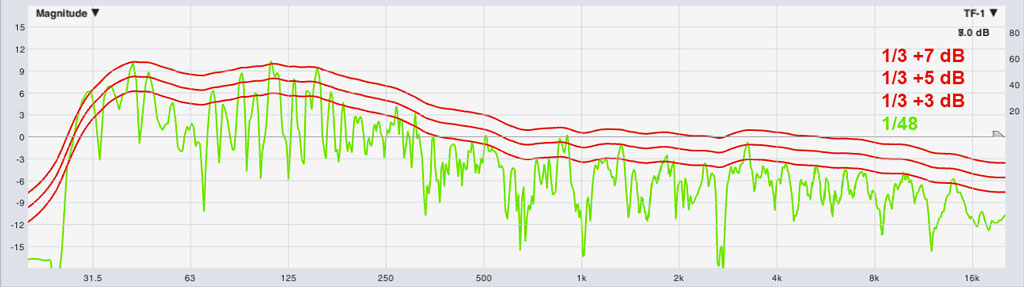 1/3 8ve smoothing shows a clear trend but distorts the most. Regardless of the amount of offset introduced, there's no best fit. The 1/3 8ve smoothing setting suggests 4 dB less spectral tilt in comparison to the 1/48 8ve smoothed trace.
Gratuitous amounts of smoothing not only alter the "apparent" tonality of the speaker or system, it also robs you from a clear indicator when you're dealing with comb filtering. The dips in the magnitude response. You'll lose another indicator if the same amount of smoothing is also applied to the phase response. The sudden jumps in phase with steeper, ergo later, slopes at the same frequencies as the dips in the magnitude response. Both indicators would request a different approach from equalizing. Especially if you take coherence into account which will drop at every dip in the magnitude response. It measures mainly noise and less signal at the position of the microphone membrane due to cancellation between the direct sound and reflection(s) or late arrival(s) from other sources.
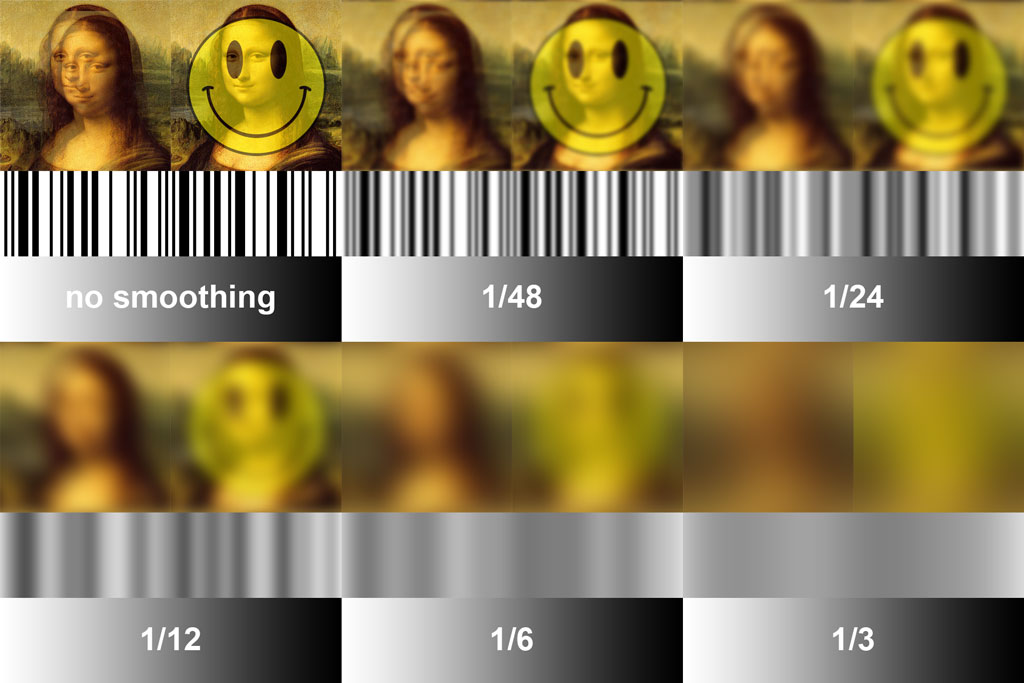
For those who are visually inclined like me. The image at the start of the article shows two Mona Lisas out of alignment (comb filtering), one Mona Lisa and something completely different (noise), a section of bar code (comb filtering) and a gradient ramp. By the time you reach 1/12 smoothing the double Mona Lisas appear to me as one. I can tell it's her, but not that there are two of her. As smoothing is increased, the bar code turns to grey and by the time 1/3 smoothing is reached, you're no longer able to discern anything, especially in absence of a reference. The only part the looks unaltered is the graduality of the gradient ramp but such behavior is not the nature of comb filtering.
The only way to truly reduce "jaggedness", both visually and audibly, is to minimize room influence and properly align multiple sources. This is achieved by speaker directivity, positioning, aiming, relative level, phase alignment and room treatment.
1 Smaart 7 help file
2 Sound Systems: Design and Optimization by Bob McCarthy