
"If you don’t know the answer before you start to measure,
how do you know you are getting a good measurement?"
- Ivan Beaver -
Chief Engineer at Danley Sound Labs
 If I were to ask you, measure the voltage coming out of the electrical outlet closest to you, using a multimeter or VOM (volt‑ohm‑milliammeter), you would have expectations. However, should your multimeter's display, for whatever reason, not show the expected voltage for your region, you have a valid reason to start investigating why. Maybe your meter's batteries are dead, or maybe a circuit breaker tripped. Regardless, you were right to question the outcome, because it didn't meet your expectations.
By extension, one could argue that the same could be said for using a dual‑channel FFT analyzer, except that most users have difficulties predicting what the results are supposed to look like and are tempted to accept the outcome at face value with little or no scrutiny. To complicate matters further, how you setup the analyzer will greatly affect the results' appearance which is the focus of this article.
Loudspeakers with a flat (or otherwise desirable) free field frequency response become "unequalized" upon deployment (typically as part of a larger sound system) for reasons beyond the scope of this article. However, those that use analyzers, resort to their computer screens to identify the changes loudspeaker or sound system underwent, in order to potentially "equalize" those changes where applicable.
Today's analyzers provide so much resolution (especially compared to Real Time Analyzers with only third-octave resolution) that users, out of the gate, typically resort to gratuitous amounts of smoothing to even out the responses in an attempt to make sense out of the madness.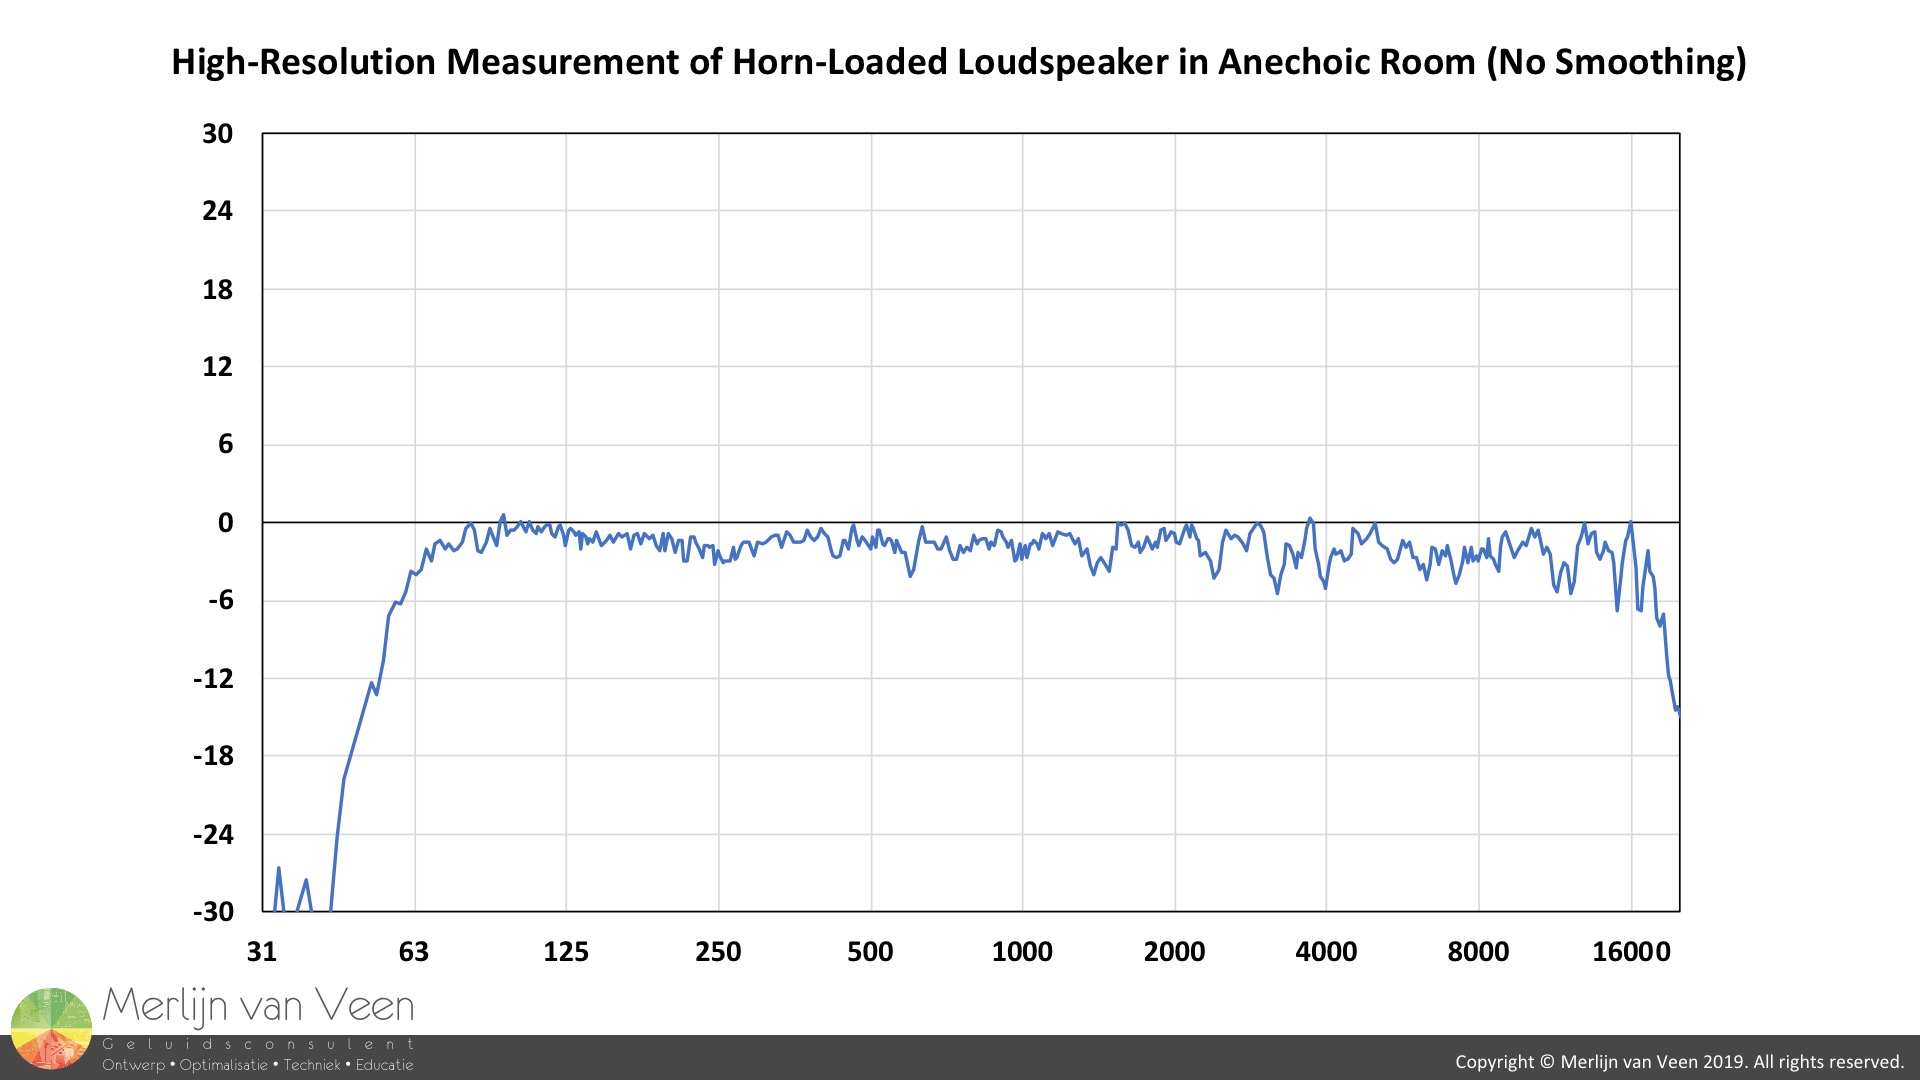 Figure 1
 Figure 2However, all that detail such as ripple, prior to smoothing, is not necessarily bad. Did you know that loudspeakers are expected to exhibit ripple, even under "ideal" circumstances such as an anechoic room (Figure 1)?
If I were to show you the edge of a razor blade under an electron microscope, you'll never shave yourself again, even though it's a perfectly good razor blade that is "razor-sharp". Like in medicine, we should apply their principal precept which is: "first, do no harm", because not every detail you see on an analyzer justifies intervention (Figure 2).
Survey
Some while ago, I reached out with a survey to my following on Facebook, asking them: "Is the Signal-to-Audience ratio, i.e., sound system loudness with respect to audience noise, expected to change the Transfer Function during a live concert?". The majority of respondents (two-thirds) said yes, and if they are correct, it would suggest that sound systems are "re-equalized" when the audience is quiet or loud.
We know this is not true unless you invoke a change such as actual EQ. So, what could have led these audio professionals to conclude that transfer functions change with audience-enthusiasm (or lack of) which would suggest a different sounding system (psycho-acoustic phenomena such masking excluded)? An important question in the interest of eye-to-ear training, if we want to measure what we hear and hear what we measure.
Noise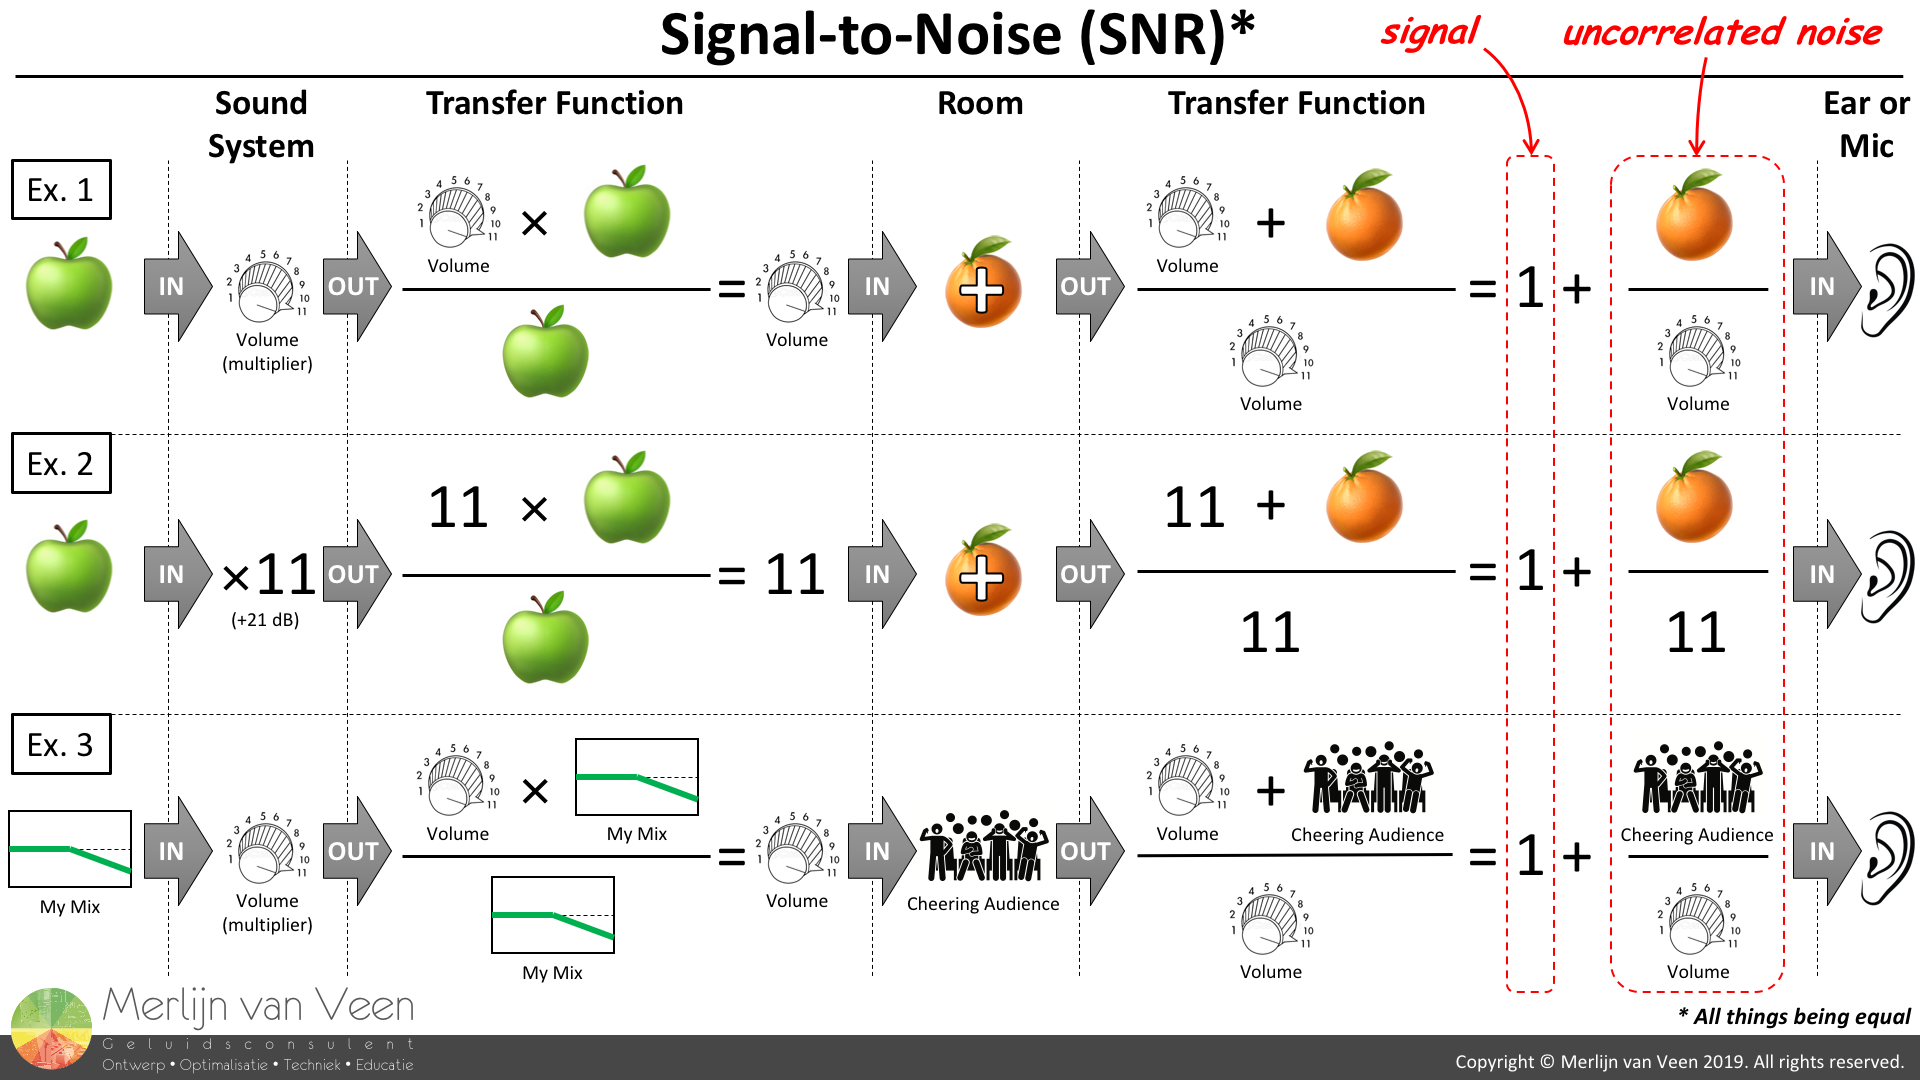 Figure 3Provided you understand a transfer function, Figure 3 should make you appreciate that audience sound effectively translates into uncorrelated noise, independent of how your mix or sound system sounds, where the Signal-to-Noise ratio (SNR) is a balancing act between sound system and audience loudness.
During a live concert, audience noise (among others) can alter the appearance of a transfer function depending on how your analyzer is set up. Therefore, it would be in our interest to understand these settings and how they affect the transfer functions' appearance so we can deliberately refrain from using EQ (do no harm), because audience noise doesn't "unequalize" the sound system.
Averaging
Imagine yourself in a crowded bar, struggling to have an intelligible conversation because of the "cocktail party" chatter and loud background music. In such a scenario, it's not uncommon to ask someone to repeat him- or herself, besides shouting which is a brute force attempt at increasing SNR. With each repetition you're likely to gain another missing piece of information, such as another syllable or consonant, because the background noise is random, meanwhile pieces of information which were already successfully received are being reconfirmed. When repeated enough times you'll be able to ultimately reconstruct the complete sentence and the message is finally received. As long as the message stays consistent with each repetition, enough repetitions will ultimately allow you to overcome the background noise.
Our analyzers, when set up correctly, offer similar functionality where each doubling of the number of averages translates into a 3 dB boost in SNR without actuality cranking up the excitation signal level by brute force. Each time the number of averages is doubled, twice the amount of correlated data (the excitation signal) is captured, making signal gain 6 dB more market share. Irrevocably, each time the number of averages is doubled, also twice the amount of contaminating uncorrelated data (noise) is captured. However, doubling uncorrelated data (unlike correlated signals) only results in a 3 dB increase. Therefore, the net increase in SNR equals the 6 dB signal boost minus the 3 dB noise boost, leaving 3 dB in favor of signal-over-noise for each doubling of averages.
Increasing the number of averages can artificially suppress the noise (floor) without raising the excitation signal level with brute force provided you choose the correct type of magnitude averaging. Magnitude averaging can be performed in two vastly different ways (or types) called RMS- and vector-averaging which can (and are likely to) affect the transfer functions' appearance to great extent.
RMS Averaging
Root-Mean-Square (RMS) averaging is effectively signal power averaging. From Ohm's law we can derive that power is proportional to squared amplitude values, and power is a scalar which is a quantity represented by a sole value that describes its magnitude. Meanwhile, the squaring operation in RMS robs us of the sign (and signs matter) leaving us with only positive values.
"Whether you owe me money or I owe you money,
the difference is only a minus sign."
- Walter Lewin -
Former MIT Physics Professor
When dealing with scalars, there's no direction which makes RMS averaging time blind as we're about to discover.
Vector Averaging
A vector (think of an arrow) is a quantity which is represented by two values that describe the vector's magnitude (the length of the arrow) and its direction (which way is the arrow pointing).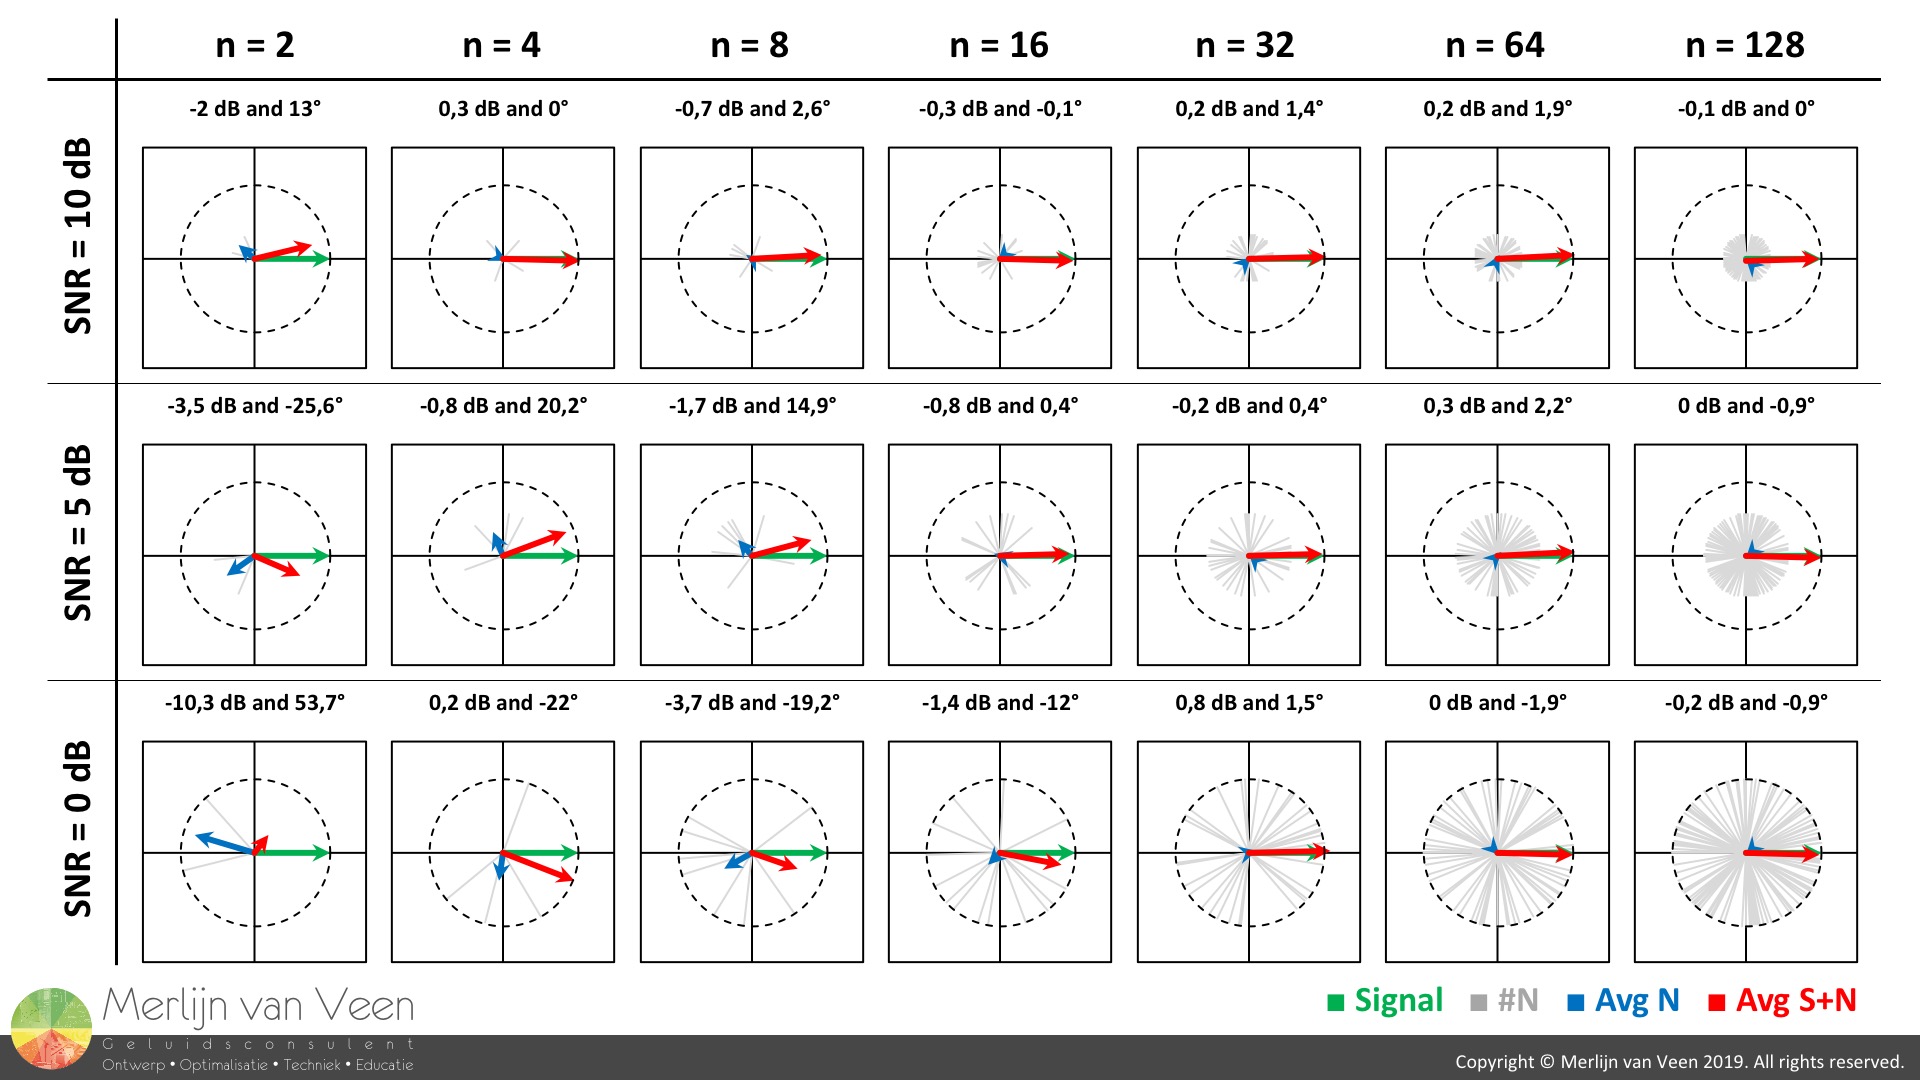 Figure 4Noise at a constant level can be represented by a vector whose magnitude remains constant over time, but whose direction changes randomly over time (Figure 4). When multiple vectors of constant magnitude, whose direction is random (random phase angle), are averaged, the mean magnitude collapses to zero as the number of averages is increased.
However, our excitation signal, when represented by a vector, preserves direction as well as magnitude over time. When averaged, the mean magnitude and direction are expected to be identical to the average's constituent components (our excitation signal).
Notice that in Figure 4, both magnitude and direction for Signal-plus-Noise approach those of signal, which is what we're ultimately after, as SNR or the number of averages is increased.
Like our hearing sense and brain in the crowded bar, vector averaging features the ability to progressively reject noise with increasing numbers of averaging.
Furthermore, having a direction descriptor in addition to magnitude (unlike the scalar), makes vectors subject to phase angles and inherently time.
When Do RMS- and Vector-Averaging Produce Identical Transfer Functions?
RMS- and vector-averaging are expected to produce near identical results only when:
- Measurement and Reference signals are properly synchronized (delay locator)
- There is little to no contamination by non-coherent signals, i.e., ample SNR and D/R
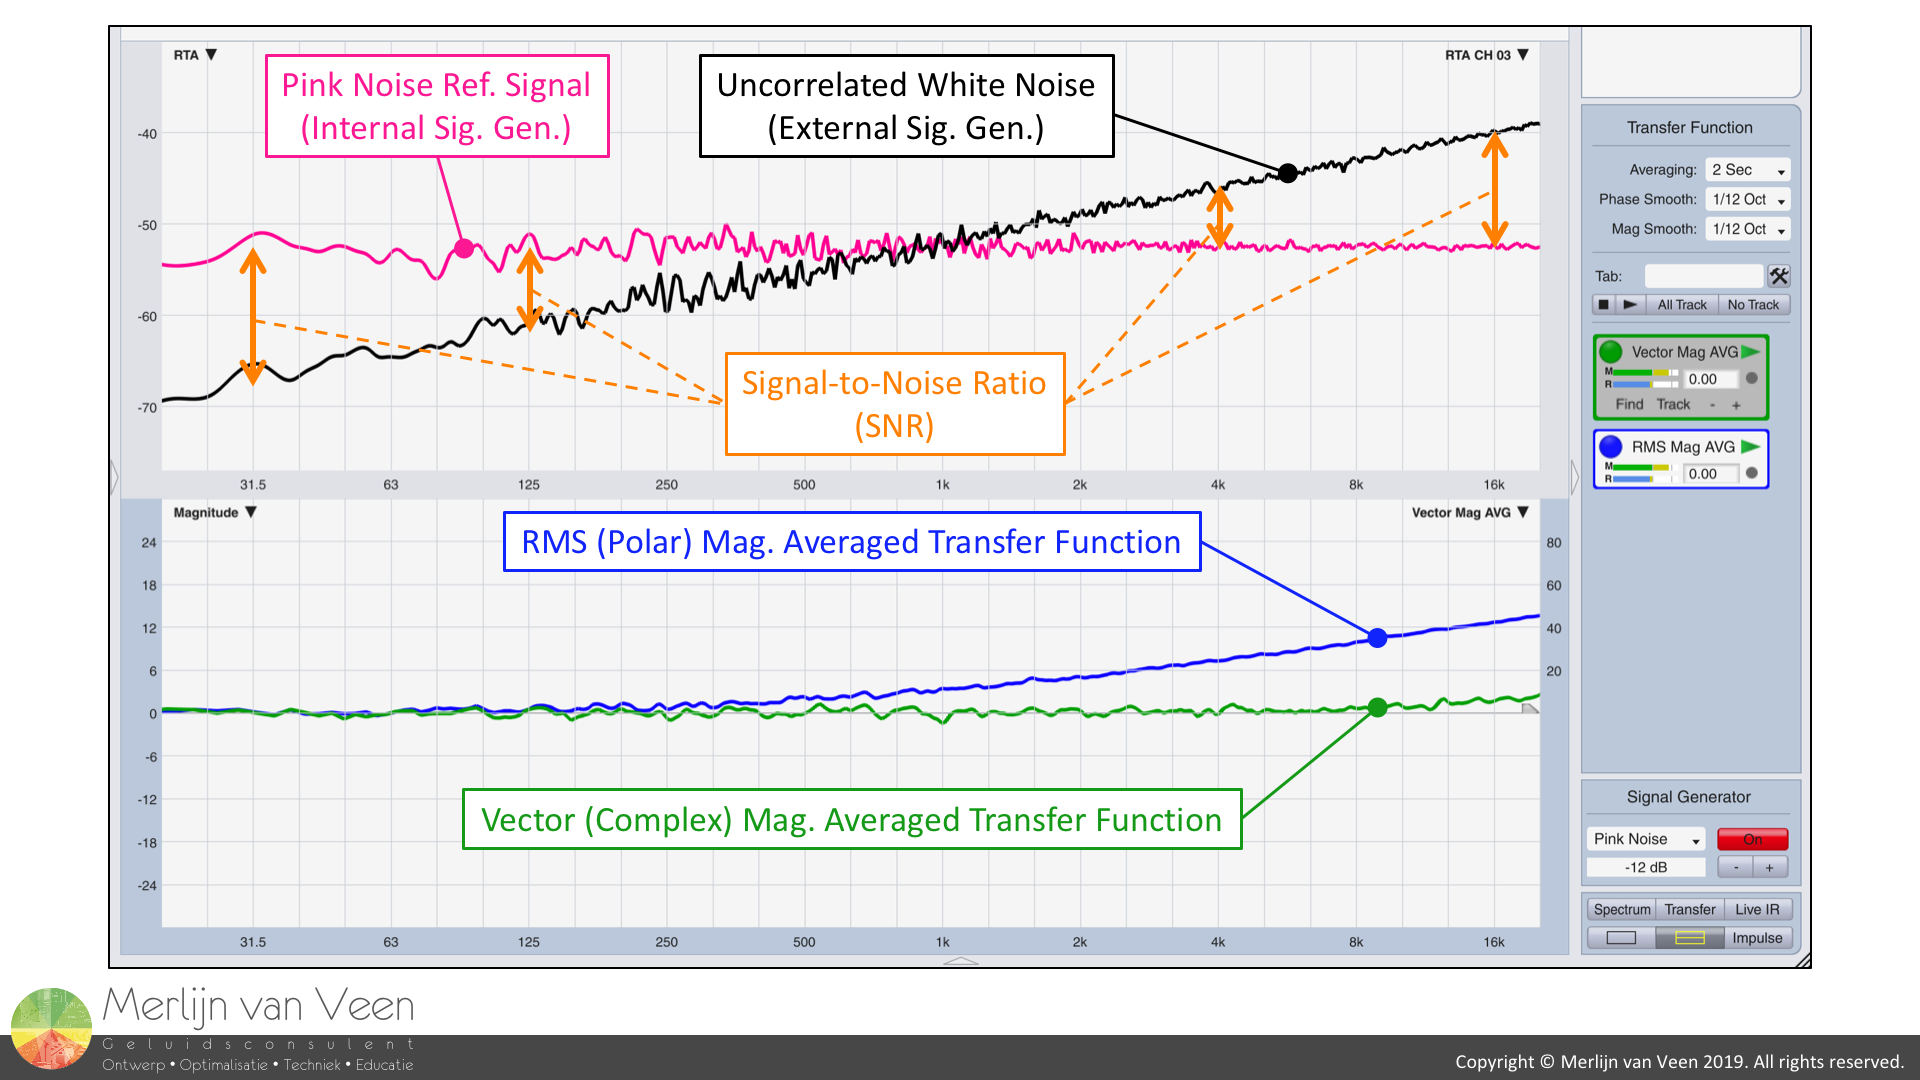 Figure 5Figure 5 shows that as long as there's ample SNR, i.e., 10 dB or more, as seen at 125 Hz and below, RMS- and vector-averaged transfer functions are in good agreement. But, with 0 dB of SNR or less, as seen at 1 kHz and above, noise determines the appearance of the RMS-averaged transfer function (blue) and no amount of averaging will change that.
Are you convinced that your audience is always 10 dB less loud than the sound system during songs?
Notice that the vector-averaged transfer function (green), even for negative signal-to-noise ratios (SNR less than zero), remains virtually unaffected with help of a modest amount of averaging.
Hostile Environment
In the real-world, comb filtering is inevitable and its frequency response ripple is a function of the relative level offset between the comb filter's constituent signal copies. Let's see RMS- and vector-averaging in action when dealing with strong ripple.
In the absence of noise, both RMS- (blue) and vector-averaged (green) transfer functions are indeed identical. When SNR is reduced to 20 dB (black line spectrum in RTA plot), with respect to the signal's spectral peaks (pink line spectrum in the RTA plot), appearances change. Notice that the cancels (valleys) of the RMS-averaged transfer function (blue) rose which is also true for the vector-averaged transfer function (green) but to much lesser extent as you can tell from looking at the orange trace underneath which is the original comb filter in the absence of noise. The transfer function peaks for both types of averaging are in good agreement.
When SNR is reduced to 10 dB, the blue valleys rise substantially which reveals a serious weakness of RMS-averaging which is it's incapability to distinguishing noise from signal. Signal (pink) has been destroyed at certain frequencies due to destructive interaction and all that's left at those frequencies is residual background noise (black) that "fills" these cancels (valleys). Regardless, this uncorrelated contamination makes the RMS-averaged transfer function look different. The vector-averaged transfer function (green), with help of a slight increase in averaging, remains in much better agreement with the orange reference trace. The transfer function peaks for both types of averaging are still in good agreement with 10 dB of SNR.
When SNR is reduced to 5 dB, the frequency response ripple for the RMS-averaged transfer function (blue) is about 6 dB. It appears as if you are in an anechoic room (Figure 1)??? Whereas the vector-averaged transfer-function (green) persists and shows you the real deal, that is to say, the actual degree of interaction which you can tell from the green ripple that has not been obfuscated by noise. Also, with this little SNR (5 dB), the transfer function peaks for both types of averaging are no longer in good agreement. For all frequencies, the RMS-averaged transfer function (blue) rose which is the limitation of RMS-averaging where signs have been lost. As SNR is reduced, RMS-averaged transfer functions can only go up.
When SNR is reduced to 0 dB, both transfer functions look completely different. The vector-averaged transfer function (green) persists and continues to show how severely compromised the system is (strong ripple) unlike the RMS-averaged transfer function (blue) where the first cancel (valley) that is 1-octave wide (11% of the audible spectrum) has been filled to the top with noise (which also goes for the remaining cancels).
Finally, when SNR is reduced to -6 dB and noise is now actually louder than signal, the blue RMS-averaged transfer function suggests there's no (destructive) interaction whatsoever, whereas the green vector-averaged transfer function persists. Under such extreme conditions, one can even set the averager to infinity (accumulate) in which case it continues to average for as long as the measurement is running, improving SNR artificially as time passes by. How long should you average? Until there's no apparent change in the data. Why wait longer without getting anything in return?
By now, I hope you can appreciate how (background) noise can really mess with the appearance of transfer functions depending on how the analyzer is set up, and EQ decisions should be made with scrutiny. However, noise is just one subset of a larger family of non-coherent signals.
Non-Coherent Signals
Real-world measurements of loudspeakers and sound systems will be contaminated with non-coherent signals, that is to say, uncorrelated signals that are not caused exclusively by a system's input signal (causality), or correlated signals that are no longer linearly dependent on the system's input signal. Non-coherent signals come in many flavors such as noise (like our audience), late arriving energy (reveberation) outside the analysis window and distortion. Let's continue with reverberation.
Useful and Detrimental Reverberation
Reverberation is a very involved topic beyond the scope of this article, but can roughly be subdivided in two categories which are useful and detrimental reverberation. Useful reverberation consists of phenomena such as early reflections whereas detrimental reverberation consists of phenomena such as discrete echoes.
It would be extremely ill-advised to make EQ decisions based on echo-contaminated measurements since echoes don't "un-equalize" the loudspeaker or sound system. Echoes are late arriving discrete copies of sounds, that originated at a source, which have become "un-fused" from the direct sound (first arrival).
If you're dealing with echoes, you should re-aim loudspeakers and keep their sound away from specular surfaces that reflect which cause the echoes (prevention), or absorb that sound energy upon impact when re-aiming is not an option (symptom treatment). EQ should only be used as a last resort when all other options have been exhausted, because EQ can't differentiate between the very thing your trying to preserve: your mix, and the thing to try to prevent: the echo (first, do no harm). If analyzers could somehow reject echoes, that would help prevent making poor EQ choices.
Time Blind
In the absence of noise, RMS- and vector-averaged transfer functions are expected to look the same when the delay locator is properly set, that's to say, when measurement and reference signals are properly synchronized. Which raises the question: what happens if they are not? In other words, what happens if my measurement signal arrives out of time?
The finite Linear Impulse Response (think of an oscilloscope) shown in the upper plot is also known as the "analysis window" whose duration is determined by the FFT-size and sample rate. In this example, the FFT-size is 16K (214 = 16384 samples) which at a sample rate of 96 kHz translates to a 171-milisecond long window.
Signals which arrive in the center of the analysis window, while the "door" is ajar, are properly synchronized and arrive in time whereas signals which arrive outside the analysis window are out of time. How will this affect the transfer functions depending on the magnitude averaging type?
Notice that the RMS-averaged transfer function (blue) continues to look the same, even when the measurement signal arrives outside the analysis window, like echoes are known to do. This implies that RMS-averaging can not tell direct sound from indirect sound and is time blind! Like noise, reveberant energy can only add to the RMS-averaged transfer function (blue) and make it rise whether it's on time or not.
Remarkably, the vector-averaged transfer function drops proportionally as the measurement signal moves towards the edge of the analysis window. By the time the measurement signal arrives outside the analysis window (late by 85 ms or more) it has been attenuated by at least 10 dB for the current number of averages. Increasing the number of (vector) averages will attenuate the signal even further. It's like "virtual" absorption has been applied which attenuates late arriving signals such as echoes (unlike RMS-averaging which is time blind).
So how late does a signal have to be to constitute an echo?
Tap Delay
Classic literature typically state single values for the entire audible band, e.g., 60 ms, which is a vocal-centric answer. However, there's no such thing as a single-time-fits-all-frequencies delay. Sixty milliseconds equal 0,6 cycles when you're 10 Hz, 6 cycles when you're 100 Hz, 60 cycles when you're 1 kHz, and 600 cycles when you're 10 kHz. After 60 ms, certain (lower) frequencies have barely finished, or are still in the process of finishing, their first complete revolution, how could they possibly have become echoic?
A conservative estimate but more realistic delay, for reasons beyond the scope of this article, is 24 cycles which is also frequency dependent. Twenty-four cycles equal 240 ms when you're 100 Hz, 24 ms when you're 1 kHz, and only 2,4 ms when you're 10 kHz! Clearly not the same time for all frequencies. When you pursuit the idea of a sole time delay for all frequencies, you're doing a tap delay which is a "rhythmic" echo. Whereas, real echoes are two or more discrete instances of the same signal which have become un-fused, and where the time gap is frequency dependent.
So, while vector-averaging is capable of attenuating echoes which arrive outside the analysis window, clearly a single fixed analysis (time) window won't suffice.
Multiple (Analysis) Time Windows
Modern analyzers use multiple time windows for the entire audible band instead of a single fixed window. This allows them to hit two birds with one stone. Firstly, multiple windows produce a quasi-logarithmic frequency resolution or Fixed Points Per Octave (FPPO) unlike a fixed window where resolution is proportional to frequency. In order to achieve FPPO, short time windows (typically 2,5 ms) are used for high frequencies and as you go down in frequency the window duration is increased exponentially to about 1 second for the lowest frequencies.
Which brings us to the second important advantage of multiple windows which is that HF-echoes will be rejected much sooner than LF-echoes, provided your resort to vector-averaging and properly set the delay locator. This gives vector-averaging the capability to capture and preserve useful reverberation such as (stable) early reflections that strongly affect tonality, and arrive inside the analysis time windows, while rejecting detrimental reverberation such as echoes which arrive outside the analysis time windows. To RMS-averaging it's all the same...
It would be really convenient if there was one more metric which could increase our confidence and keep us from making poor EQ decisions.
Coherence
Coherence is a statistic metric that is proportional to the ratio of coherent signal power to coherent plus non-coherent signal power (which is the total signal power).
\begin{equation}Coherence\propto\frac{Coherent\ Power}{Coherent\ Power + Non\mbox{-}Coherent\ Power}=\frac{Coherent\ Power}{Total\ Power}\end{equation}
It describes the fraction of a system's total output signal power that is linearly dependent on its input signal power (Equation 1).
In the absence of non-coherent signals, coherence is expected to have a value of 1 or 100%. In the absence of coherent signals, coherence is expected to have a value of 0 or 0%. Coherence is a "lump" indicator because non-coherent signals come in many flavors.
Since coherence is always computed vectorially, it is susceptible to phenomena such as noise, late arriving energy outside the analysis windows (echoes) and even distortion. What it won't do, is tell us which is which. For that you need an analyzer which is not the software. The software is just a tool, like an army knife. We users are the actual analyzers (thank you Jamie) and it's up to us to determine the nature of non-coherent power...
Puting it Together
High-coherent data is actionable data. Below you see an example of an extremely crappy measurement which makes for a good example.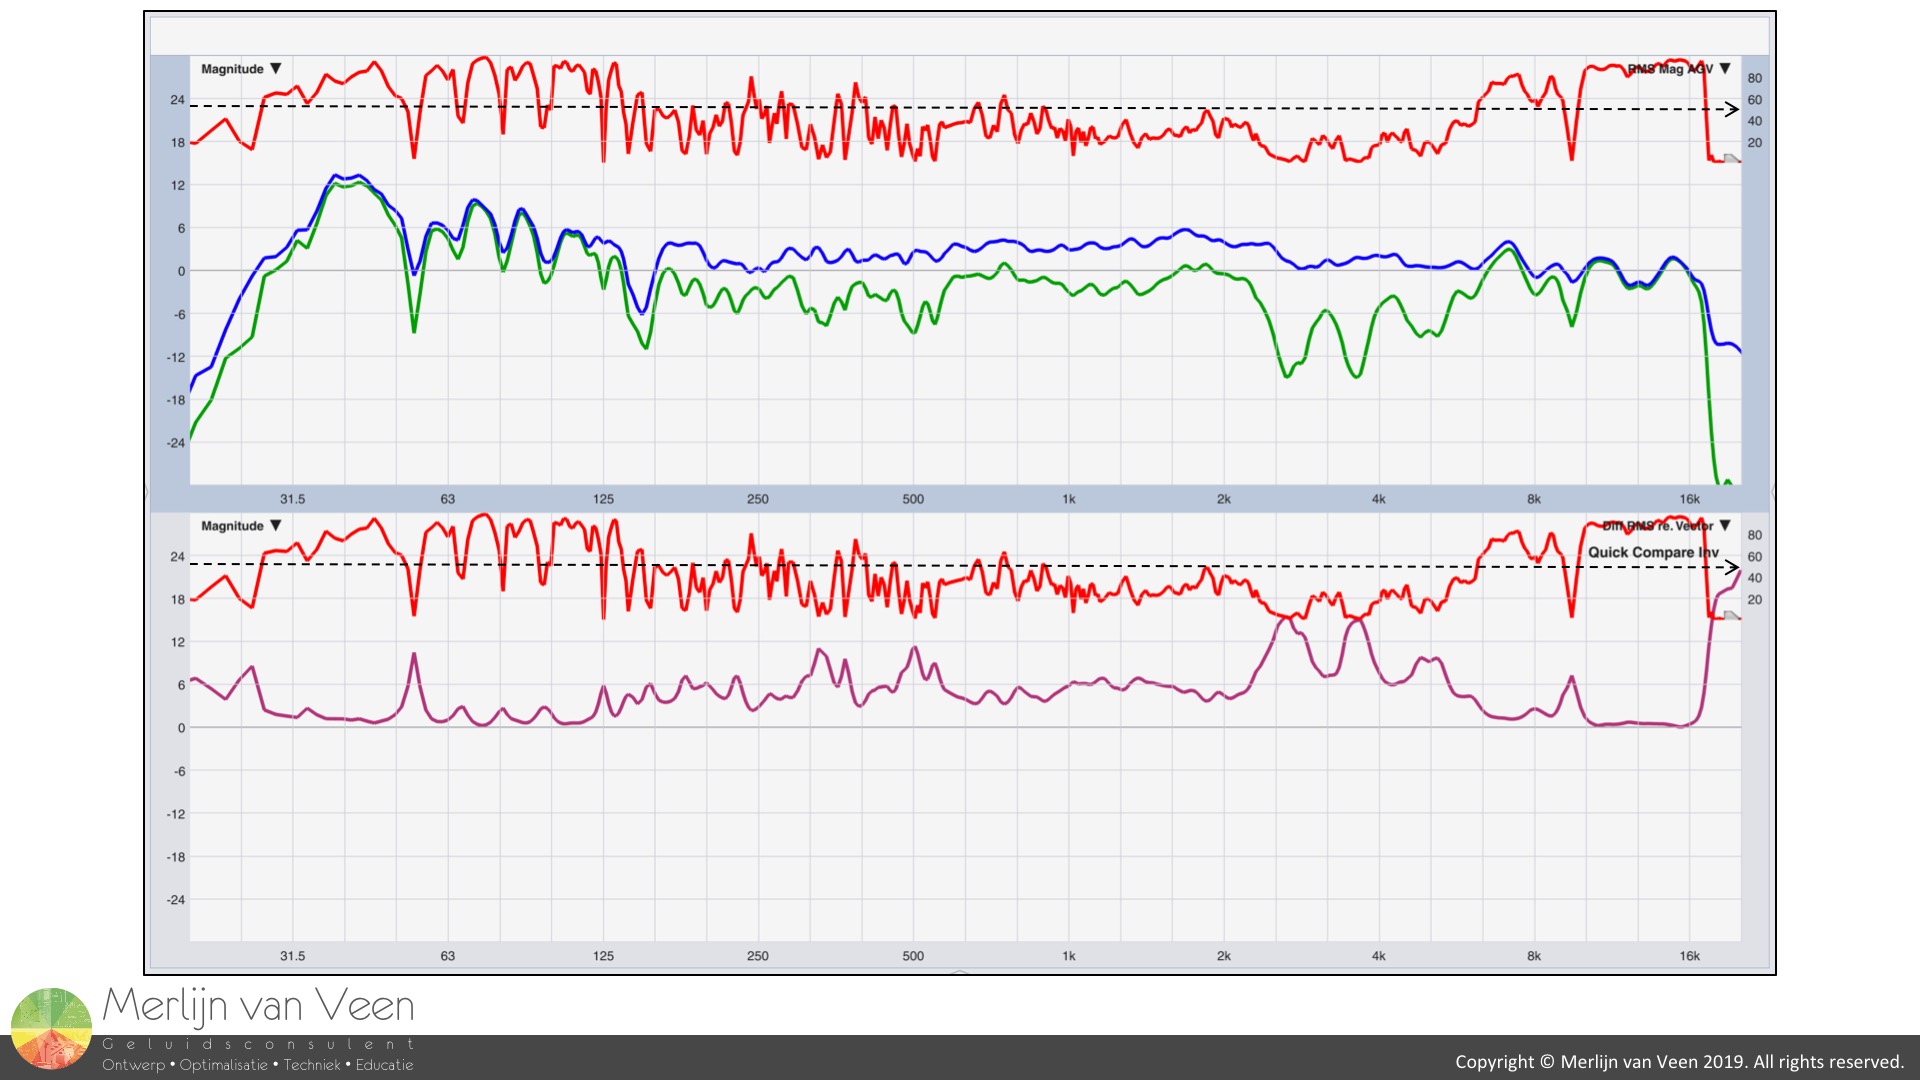 Figure 6
As of Smaart v8.4.1, the program now features the option to display squared coherence like SIM which is very convenient. If you look at Equation 1, you should be able to appreciate that 1 part coherent power and 1 part non-coherent power equal 1/2 or 50% coherence or a 0 dB coherent-to-non-coherent power ratio. In other words, 50% is the break even point which I indicated with the black dashed line in both plots.
RMS- and vector-averaged transfer functions are expected to be near identical when coherent power exceeds non-coherent power by 10 dB, independent of the flavor of non-coherent power. Since coherence deals with signal power, you should apply the 10log10 rule that informs us that +10 dB equals a factor x10. Therfore, 10 parts coherent power against 1 part non-coherent power equal 10/11 (Equation 1) or 91% coherence.
When coherence equals 91% or more, notice that both transfer functions in the upper plot are in good agreement. However, once that condition is no longer met, the traces start to differ substantialy. By how much exactly, can be seen in the bottom plot where we see the difference with help of "Quick Compare".
Vector-averaging will always give you an objective measurement, even under hostile circumstances, provided you use enough averages. Under stable conditions (no redecorating the venue with a wrecking ball or moving loudspeakers), it will reveal at one point in space, where your measurement microphone lives, if, and to what degree, the sound system has become compromised due to speaker-to-room and speaker-to-speaker interaction, and is very immune to change unlike RMS-averaging.
However, when coherence drops below 50%, non-coherent power dominates over coherent power, any EQ decisions based on RMS-averaged transfer functions should be postponed until one has convinced oneself first of the flavor of non-coherent power. Is it noise (including the audience), late arriving reverberant energy outside the analysis windows or a combination of both? Because, any EQ decisions based on the appearance of low-coherent RMS-averaged transfer functions whose shape is determined by dominating non-coherent power (bottom plot in Figure 6) and not signal, should be made with utmost caution!
Noise can be ruled out by first capturing a line spectrum of the noise floor prior to turning on the excitation signal (generator). Once the noise floor has been captured, you can turn on the generator and capture another line spectrum. If the latter lives 10 dB or more above the former, you should be good. This could still leave local SNR-minima at certain frequencies were the direct sound has been killed due to destructive interaction which is something that vector-averaged transfer functions and coherence reveal.
Evidently this option is no longer available come showtime, and you will have to make a judgement call about the signal-to-audience ratio before considering changing any EQ's, that is, if you're still convinced that audience sounds can "un-equalize" a sound system ;-)
If actual noise has successfully been ruled out for low-coherent RMS-averaged data, the remaining culprit is most likely late arriving detrimental reverberant energy which implies that your facing a negative Direct-to-Reverberant ratio (D/R) which EQ can't fix, because EQ doesn't alter the directional behavior of a loudspeaker or sound system, nor does it add absorption to the venue, nor does it close the distance between audience and sound system. The remaining options speak for themselves.
While first arrivals are always anechoic, indoors, reverberation is destined to catch up and stable (early) first order reflections are likely to add gain (room gain) which greatly affect the listening experience. This kind of useful reverberation is admitted for both RMS- and vector-averaged transfer functions, but in addition, the latter averaging type rejects detrimental reverberation which requires a different remedy.
Conclusion
This article is not meant to be an exercise in better or worse. That being said, RMS-averaged transfer functions are very prone to circumstances and there are many rules-of-engagement for interpreting the data whereas vector-averaged transfer functions are much more resilient. When used together, side by side, both averaging types make for a very complete picture. But even more important, is a proper understanding of coherence, cause it will inform you whether your measuring the sound system or the audience. Regardless, high-coherent data is reliable, actionable data!
This article is also featured in the November 2020 issue of Live Sound International magazine.