 Crest factor should be treated with scrutiny in the absence of context. Don't assume that the crest factor of an electronic signal's oscillogram is preserved once the signal is airborne.
![]() figure 1By the end of this century's first decade (2000s), when the loudness war (also known as loudness race) reached its peak, a foundation was initiated whose mission was to classify and grade commercial audio CDs with a Dynamic Range symbol (figure 1) where Dynamic Range is a metric that can be thought of as crest factor which is a waveform's peak-to-rms amplitude ratio expressed in decibels.
figure 1By the end of this century's first decade (2000s), when the loudness war (also known as loudness race) reached its peak, a foundation was initiated whose mission was to classify and grade commercial audio CDs with a Dynamic Range symbol (figure 1) where Dynamic Range is a metric that can be thought of as crest factor which is a waveform's peak-to-rms amplitude ratio expressed in decibels.
At the time, Tischmeyer Technology (now MAAT), in collaboration with Algorithmix, developed a VST plug-in as well as a standalone application which measure the Dynamic Range (DR) values for a single track or an entire album. This gave rise to numerous databases such as dr.loudness-war.info, containing dynamic range data for hundreds of thousands of commercial albums. Collectively, these databases provided compelling evidence to support the notion that music became less dynamic during the late 1900s.
In its heyday, prior to replay volume normalization used by today's streaming services, the loudness race allegedly led to albums with dynamic ranges of 4 dB or less (FYI the dynamic range of a sine wave is 3 dB). Some of these notorious albums even made it into the press which makes you wonder if artists and producers were aware of what they were doing at the time?
The dynamic range initiative, while admittedly brilliant and instrumental in ending the loudnsess war, appears to be susceptible to one caveat; it seems to focus exclusively on the electrical waveform, as stored on the medium, while possibly disregarding the influence of the playback signal chain, i.e., playback equipment and loudspeaker system.
Regression toward the mean
Normal-distributed (Gaussian) noise, e.g., pink noise, typically features a crest factor of roughly 12 dB on average. In order to produce a noise signal with a crest factor of less than 12 dB, its spectral component's phases need to be (re)arranged in a specific manner which results in very delicate and volatile equilibrium.
This equilibrium is preserved as long as the individual spectral component's phases aren't rearranged while the signal is traversing the signal chain which requires the latter to be linear phase such as a microphone cable.
However, ultimately and without exception, such a carefully crafted signal will pass through a delivery platform which consists of one or more transducers (loudspeaker or headphone) that transform voltage into sound pressure. This delivery platform is very likely, if not always, to feature a high-pass filter1 (typically anywhere from 25 Hz to 250 Hz depending on the size of the system), either by acoustical-mechanical design or electronically, that makes a signal with low crest factor regress towards the mean value of 12 dB.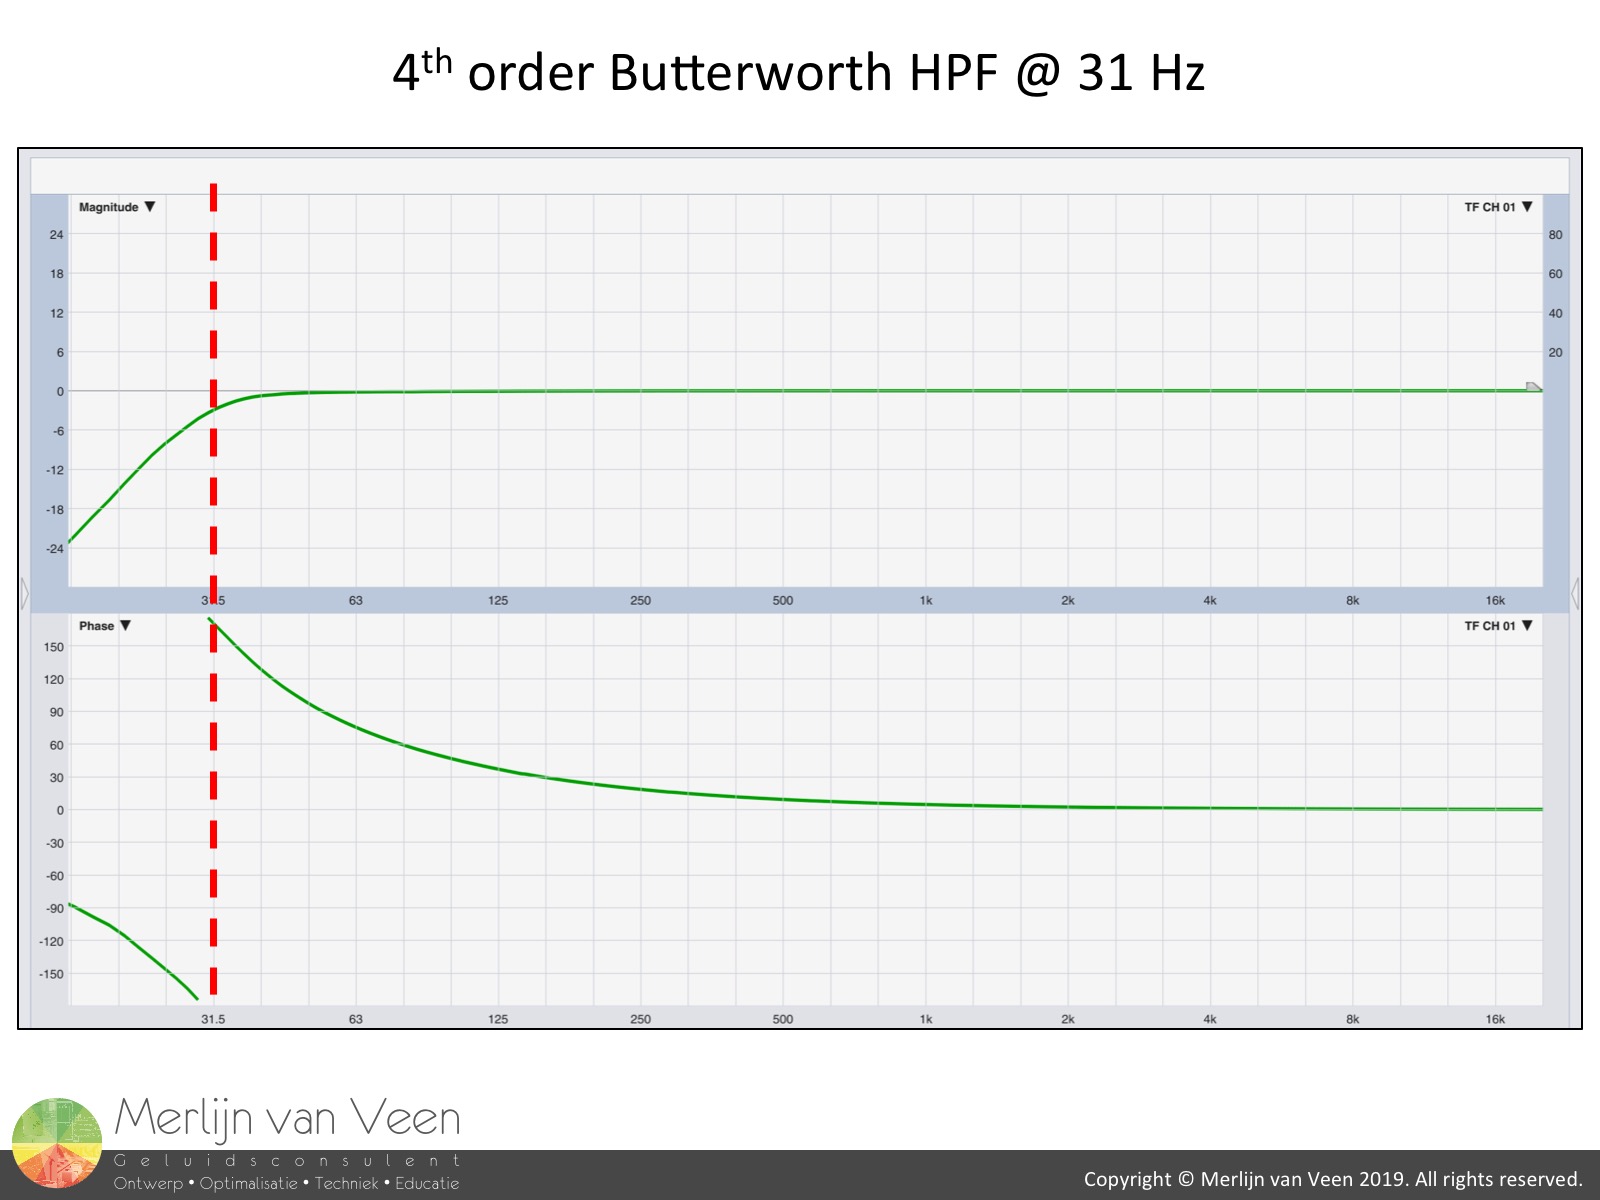 figure 2Figure 2 shows the transfer function of a 4th order high-pass filter at 31 Hz whose pass-band allows the bulk of most music content to pass. Notice that the filter comes with 360° of phase shift.
When a low-crest-factor (6 dB) noise signal is sent through this filter, its 6 dB crest factor regresses towards 12 dB.
Notice that in the video above, the waveform post high-pass filter, in track 2, is substantially more jagged, indicating a higher crest factor.
The phase shift inherent to the high-pass filter has scrambled the carefully arranged spectral component's phases, destroying the delicately built house of cards. The crest factor has increased and a sound level meter will confirm that.
Question remains, will the same happen for music?
Low-dynamic music
The video below shows the same experiment using a track from one of those notorious albums.
Notice that like before, crest factor post high-pass filter, in track 2, is substantially higher.
Artistic-Decision-Making-Process
I like to think that artists and producers alike, make artistic decisions based on what they hear coming out of the studio monitors, the delivery platform. A platform whose inherent phase shift can alter crest factor.
For the specific track in the example above, one possible explanation could be that a crest factor of roughly 12 dB was indeed pursued artistically. However, on the storage medium, upstream, the crest factor of the actual waveform itself measures more like 6 dB.
Imagine that the latter value would end up as rating on the CD cover in an industry where extremely low dynamic music is frowned upon. Would that be an entirely unbiased classification? By extension, think about the additional steps taken when mastering for vinyl and how they might affect crest factor.
These phenomena are prime examples that hopefully illustrate the importance of understanding the delivery platform and how it might affect the artistic-decision-making-process.
High-dynamic music
Contrary to low-dynamic music, high-dynamic music is much less prone to the effects of the delivery platform's high-pass filter phase shift.
Notice that in the video above, the waveform post high-pass filter, in track 2, is almost identical.
Scrutiny
This little exercise hopefully demonstrated that dynamic range or crest factor should always be treated with scrutiny. High crest factor oscillograms are more likely candidates to be judged at face value whereas low crest factors require context.
For more information please read AES standard AES2-2012: Methods of measuring and specifying the performance of loudspeakers for professional applications.
1 Several links in the playback signal chain, besides the loudspeaker or headphone, can actually introduce a high-pass filter. But, loudspeaker and headphone are likely to do so with little to no exception.