
 "Blindly accepting a transfer function without knowledge of the details of the time record that produced it is all too common, and using such can make good gear perform poorly"
- Pat Brown -
This quote by Pat Brown of SynAudCon (among others) was brought to my attention by fellow instructor Fedele De Marco who posted it on his Facebook page Il Lato Oscuro della Fase (The dark side of phase).
Pat Brown makes a good point that inspired me to write a series of articles about the considerations involved in determining the appropriate length of a time record and why some FFT analyzers make use of multiple time records at once.
FFT & resolution
FFT analyzers make use of the Discrete Fourier Transform (DFT) to transform a waveform (amplitude over time), e.g., picked up by a measurement microphone, into a frequency spectrum (amplitude over frequency) showing us the spectral content of that waveform.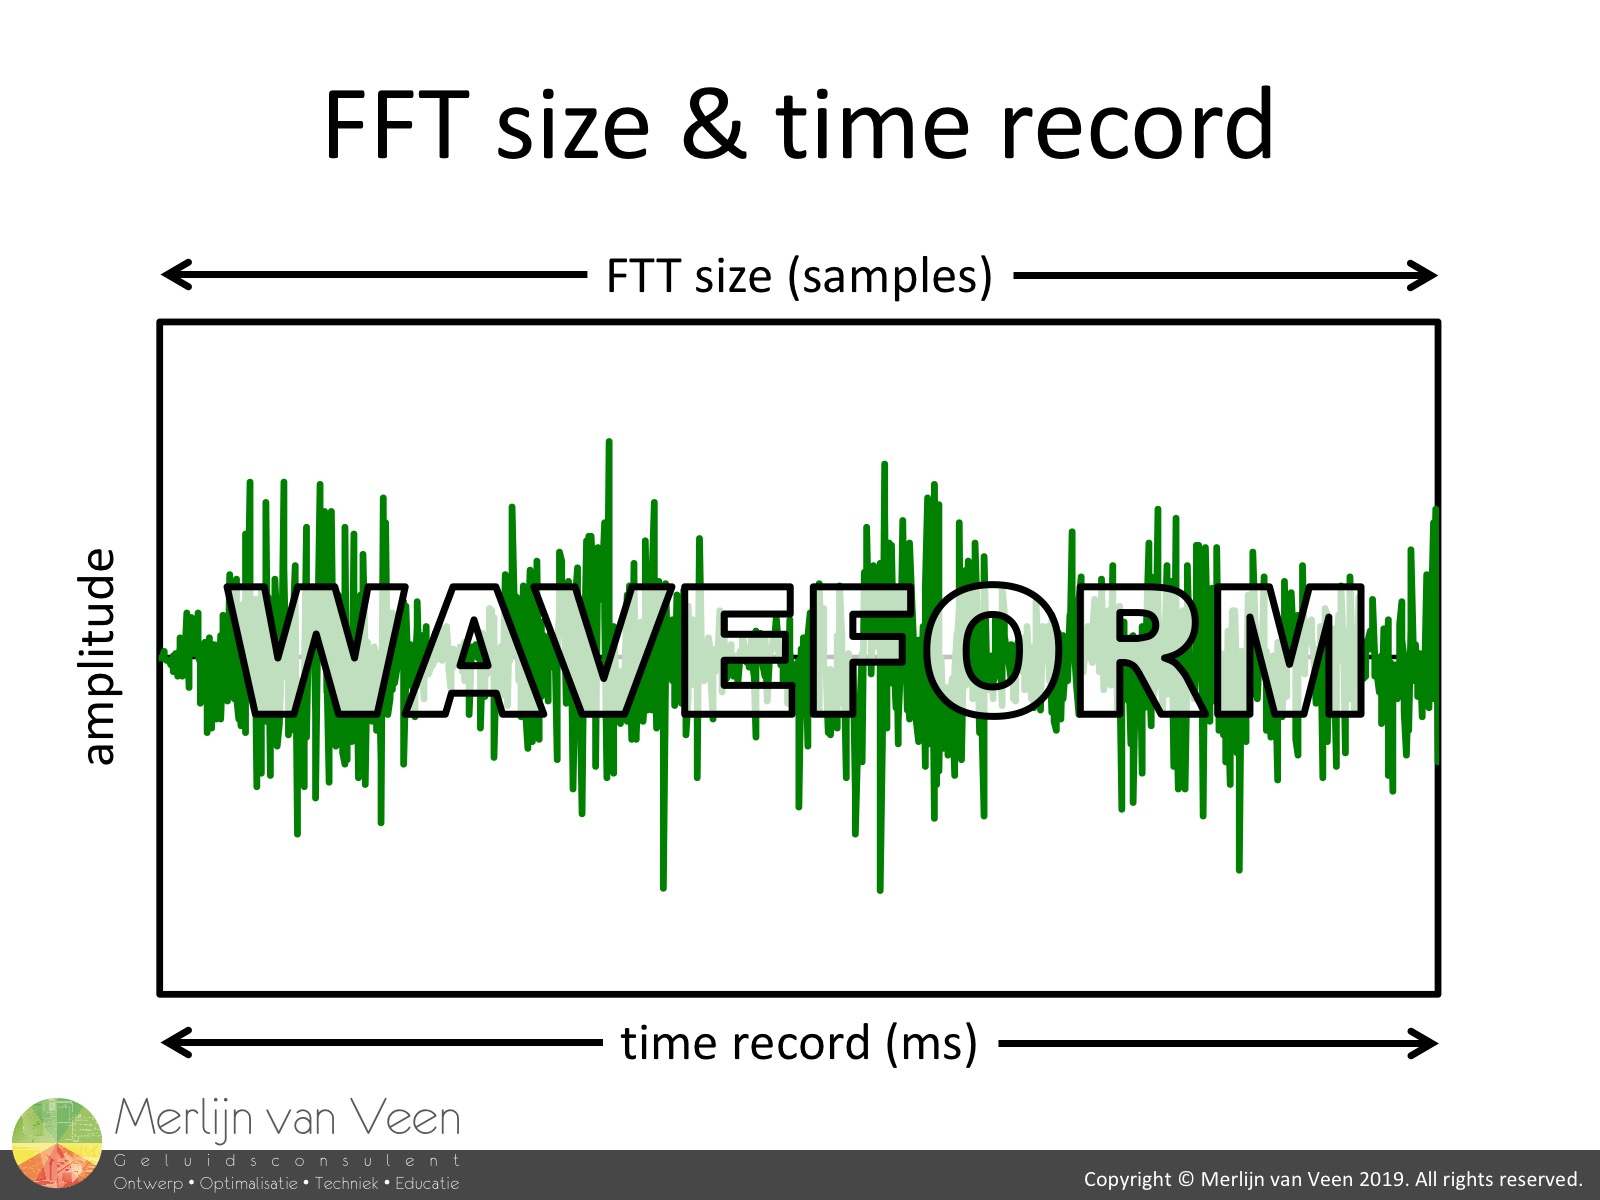 figure 1The frequency resolution of that spectrum is determined by the so-called FFT size and sample rate. The FFT size, expressed in samples, represents a time record, constant or window (which I mix up indiscriminately).
The time record is the actual "slice" of waveform of which we want to know the spectral content (figure 1). To calculate the time record from a given FFT size use equation 1.
\begin{equation}TR=\frac{FFT\,size}{SR}\end{equation}
Where TR is the time record in milliseconds and SR is the sample rate in kilohertz.
For an FFT size of, e.g., 1K (notice the capital K) which is 1024 samples. The time record would be 21 ms at a sample rate of 48 kHz.
To go from time record to frequency resolution use equation 2.
\begin{equation}FR=\frac{1000}{TR}\end{equation}
Where FR is the frequency resolution in hertz.
For a time record of 21 ms, the frequency resolution would be 47 Hz.
To go straight from FFT size to frequency resolution use equation 3.
\begin{equation}FR=\frac{SR}{FFT\,size}\end{equation}
Where SR is the sample rate in hertz, no longer kilohertz.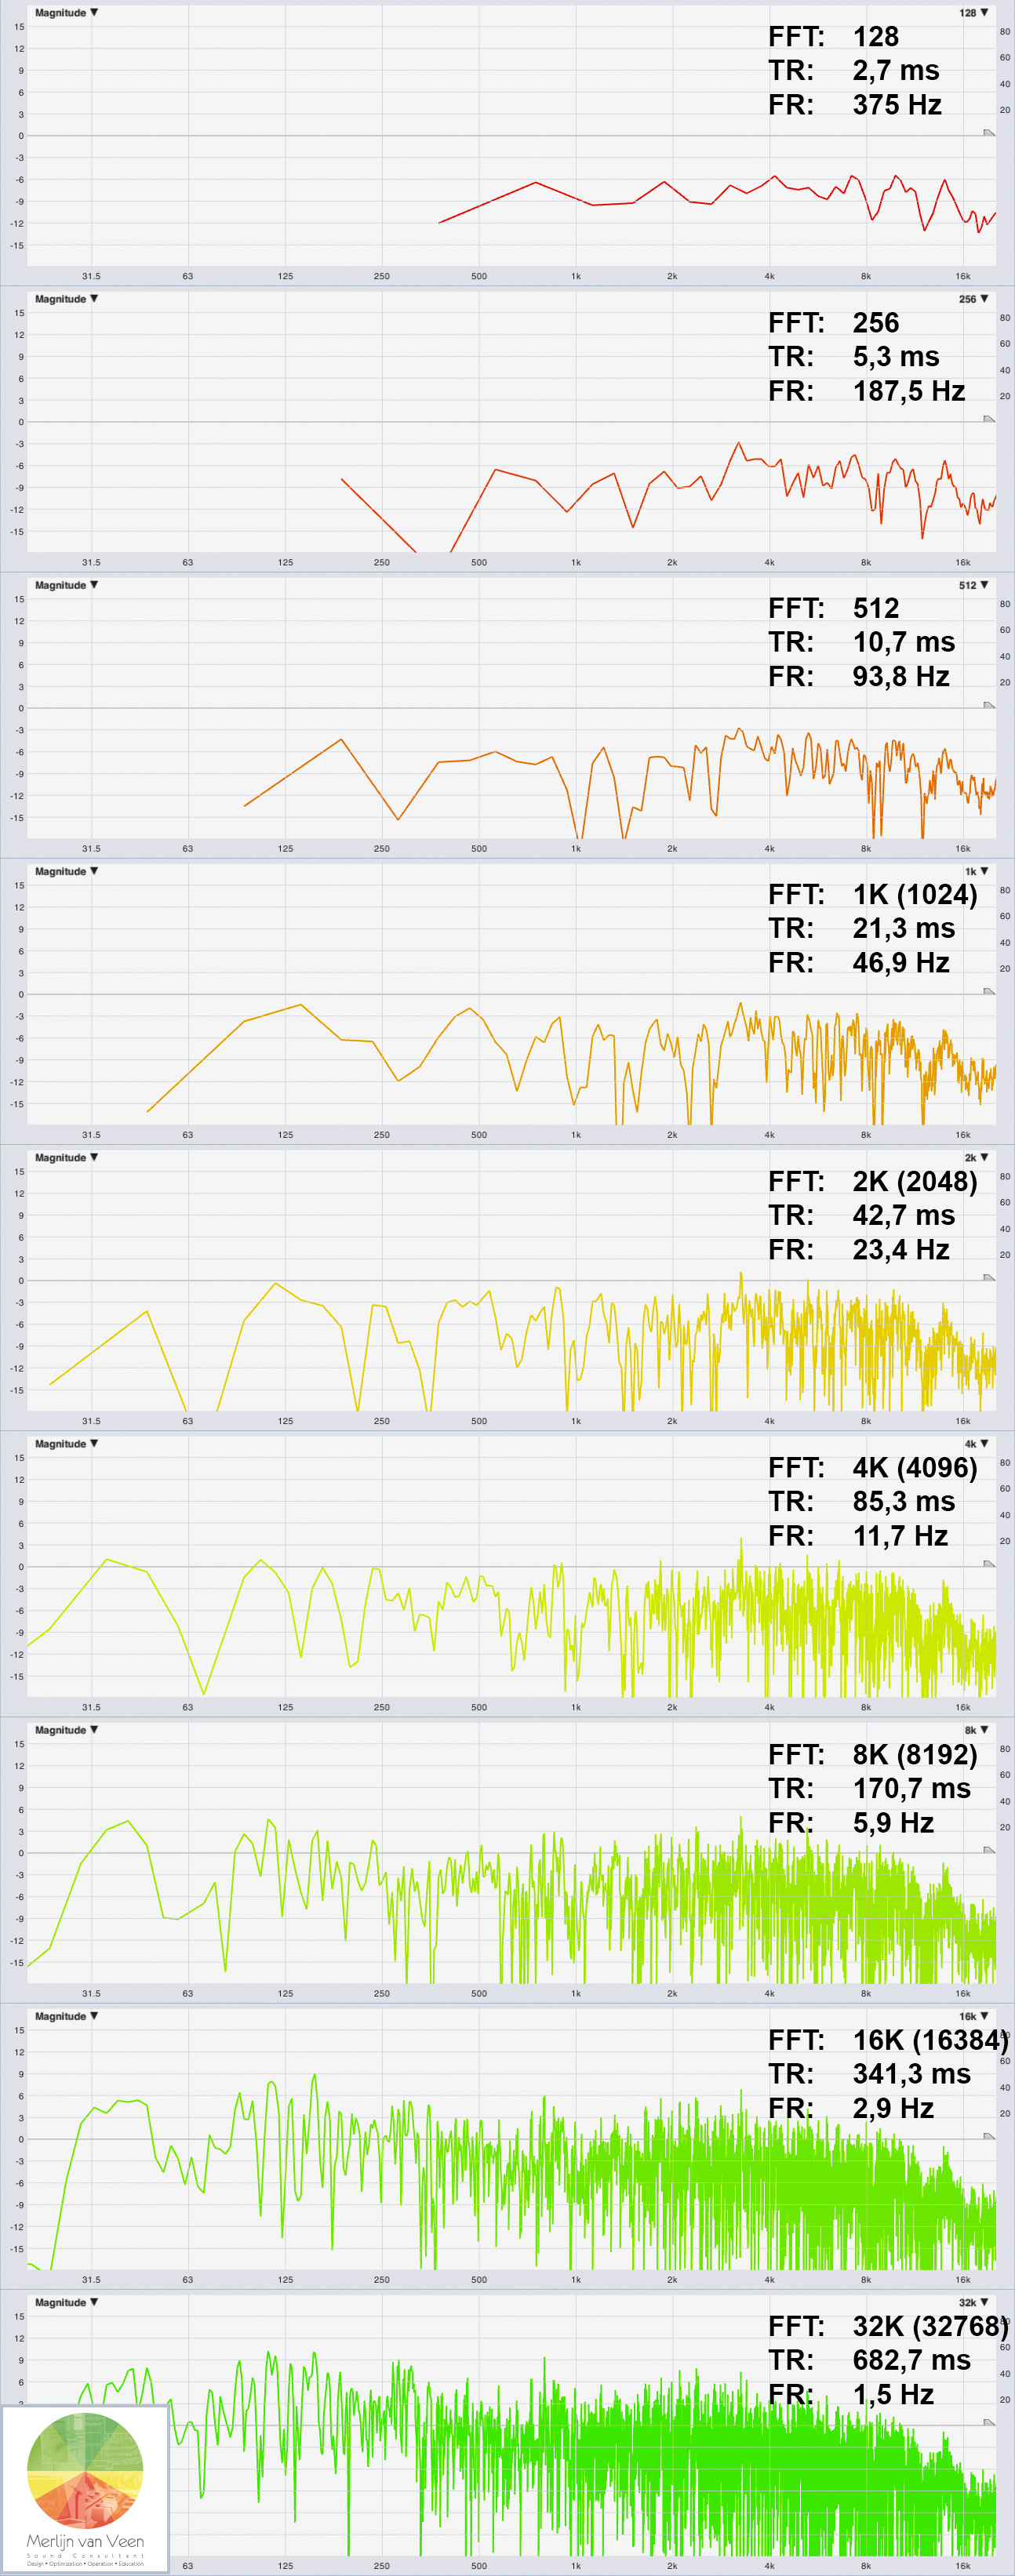 figure 2What I call frequency resolution is often referred to as "bin width" where a single "frequency bin" can be thought of as spectrum sample or "frequency-step".
The total number of bins equals:
\begin{equation}N_{bins}=\frac{FFT\,size}{2}\end{equation}
The number of bins or spectrum samples is proportional to the FFT size. An increase in FFT size results in more bins where each bin itself is narrower. Hence, increased frequency resolution.
Figure 2 shows transfer functions of the same sound system using various different FFT sizes for the entire audible spectrum. Notice that when the FFT size goes up and time records become inherently longer, frequency resolution increases.
For a waveform to be fully characterized, it must complete at least one full cycle within the duration of the time record. As a consequence, lower frequencies, with longer time periods, require longer time records.
Which bring us to the all-important question of how much resolution is enough? In order to answer that question, we need to look at the way we hear.
JND (pitch)
A just-noticeable difference or JND is the smallest amount by which something must change in order for a difference to be noticeable. For amplitude, the JND for humans is around 1 dB.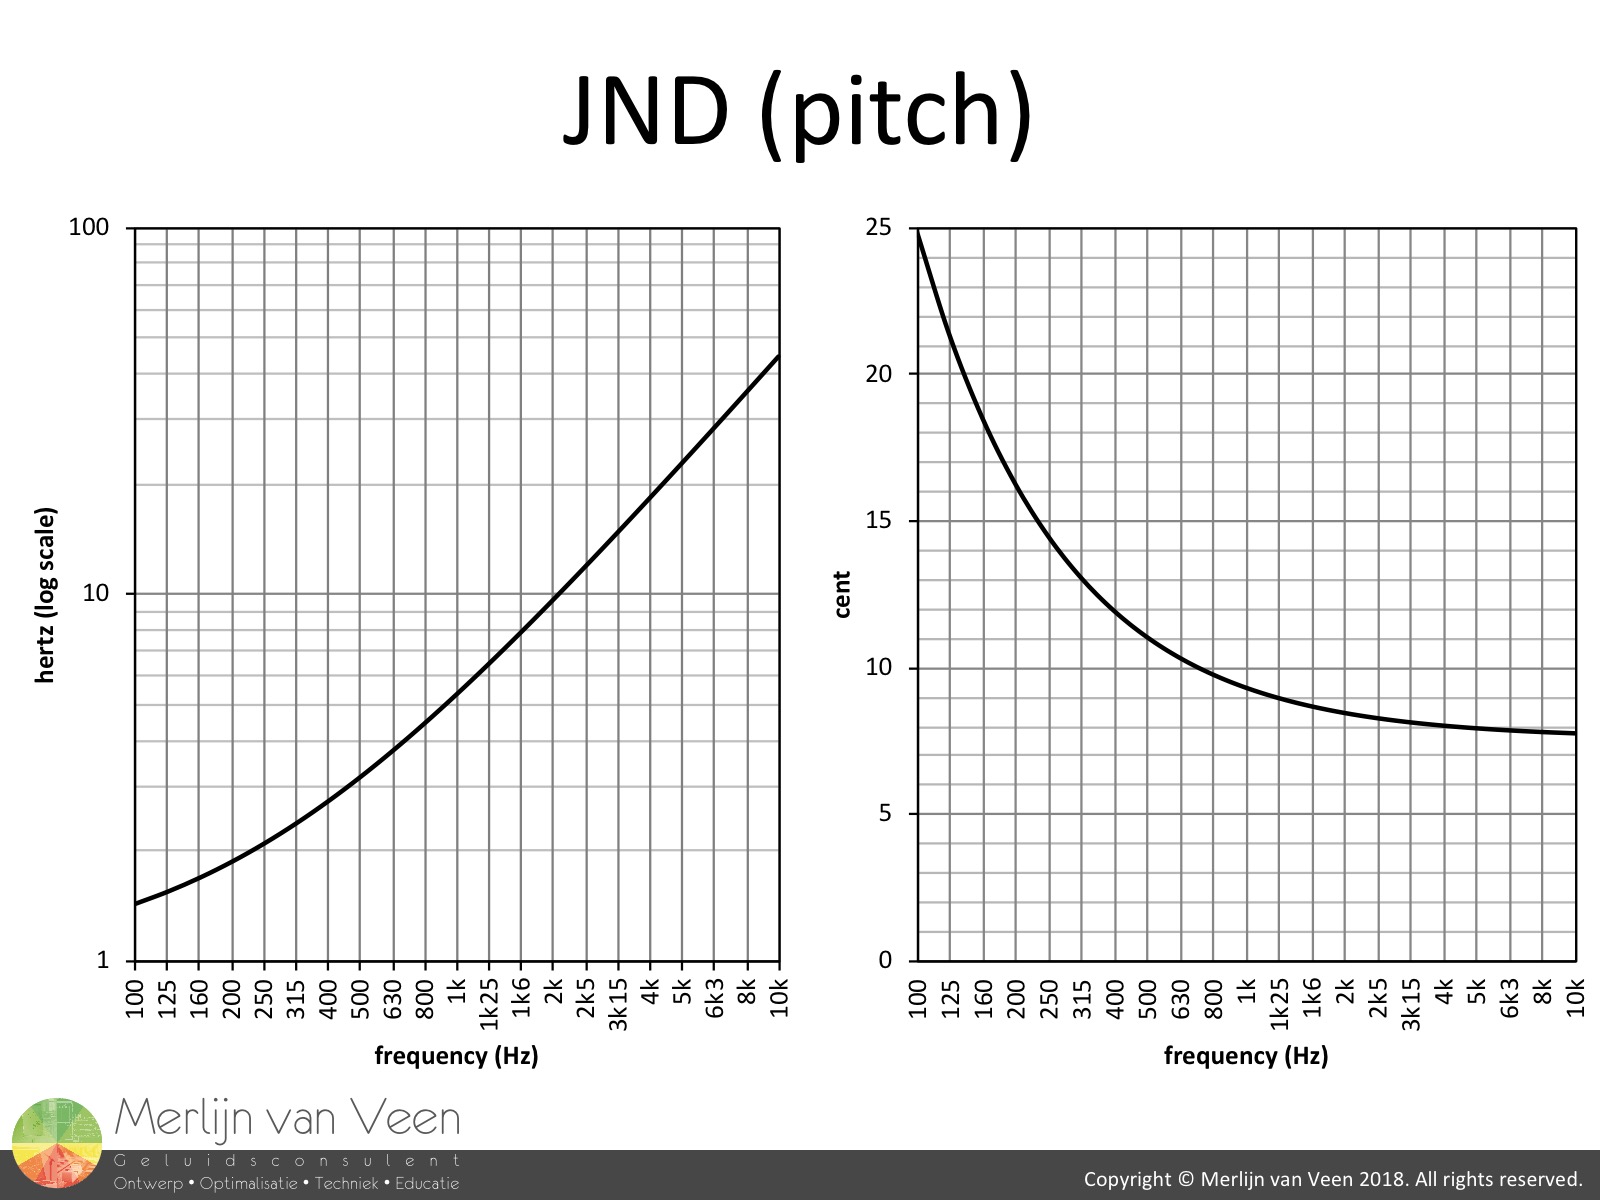 figure 3For the perceived pitch of pure tones (sine waves), the JND is typically tested by playing two tones in quick succession with the listener asked if there was a difference in their pitches. Figure 3 shows the result in hertz and cents.
Click here to watch the accompanying YouTube video where I demonstrate JND.
The total number of perceptible pitch steps in the range of human hearing is about 1400. For the 10‑octave audible range from 20 Hz to 20 kHz, this translates into roughly 140 pitch steps per octave or, more generic, 140 Points-Per-Octave (PPO). So how many PPO does a single FFT size produce for the entire audible spectrum?
PPO vs. FFT size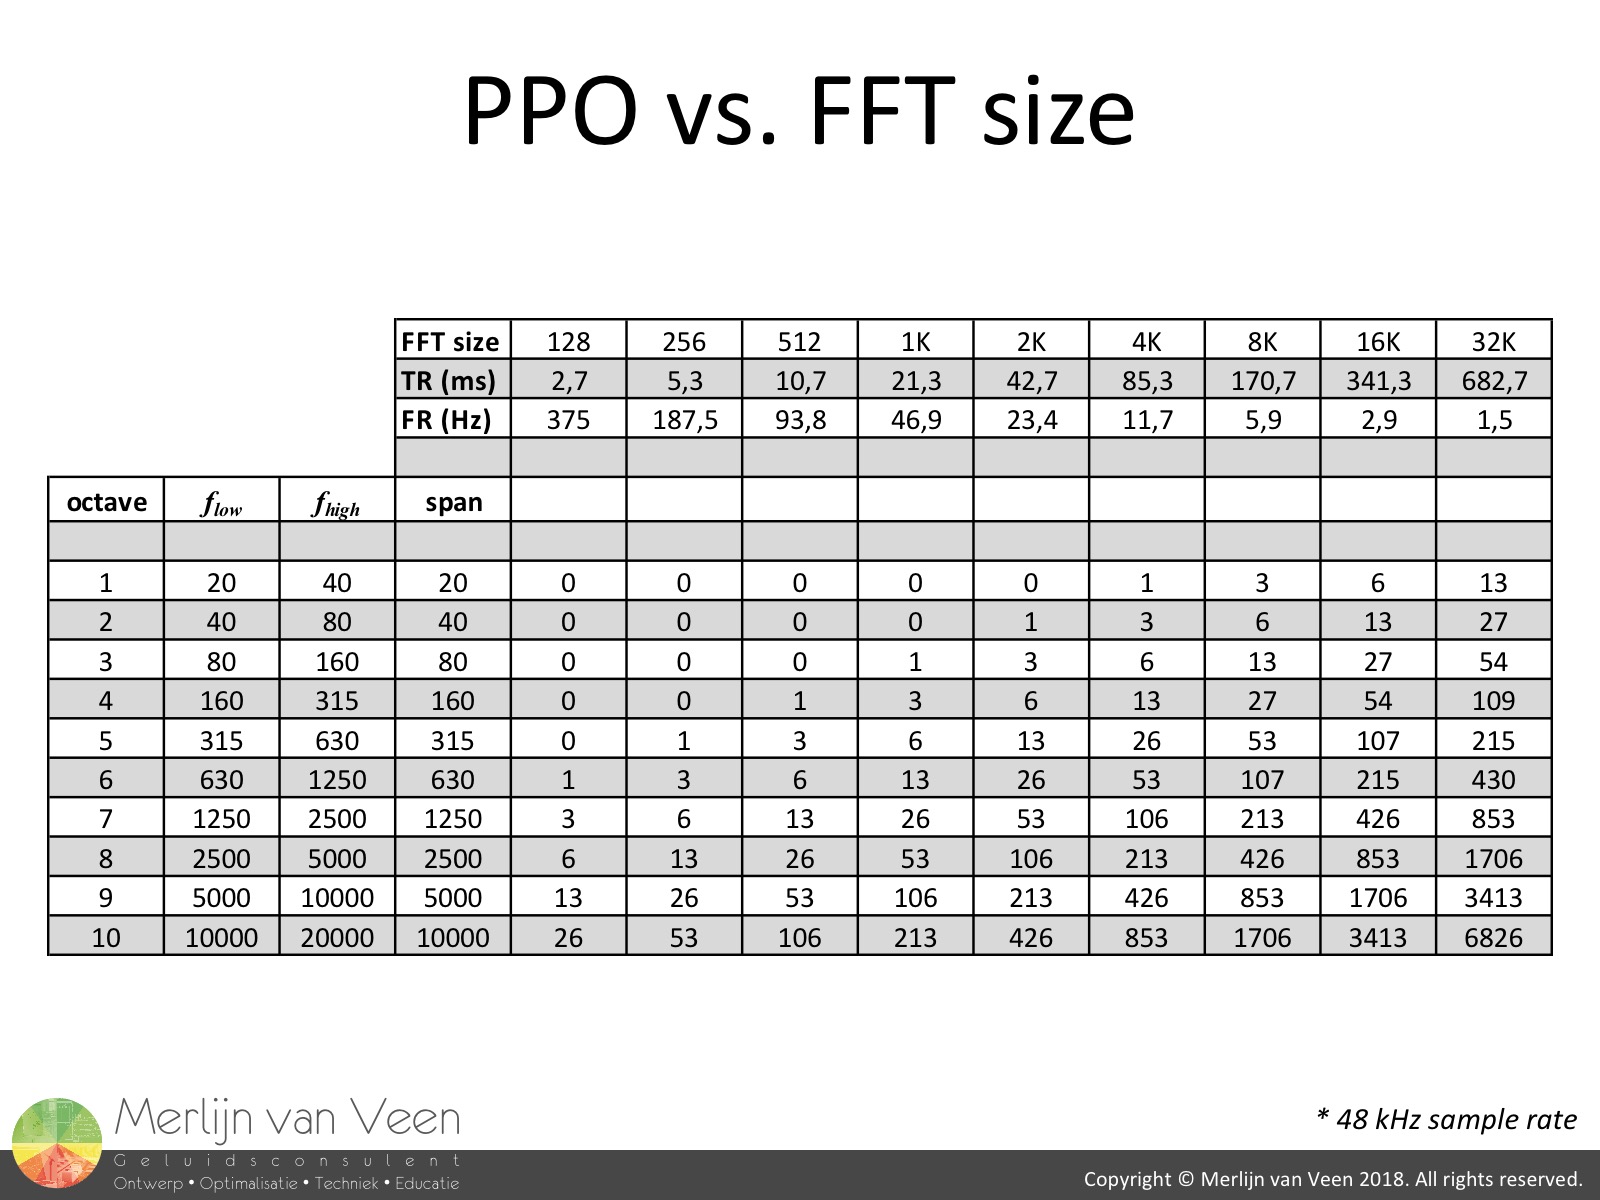 figure 4Figure 4 shows typical values for a sample rate of 48 kHz. Based on our understanding of the JND of pitch, one could argue that PPO in excess of 140 is overkill. That many PPO exceed our capability to detect a change in pitch and inherently tonality.
Too much resolution sets the table for over-equalization. Look again at figure 2, I think it's safe to say that for certain frequencies, particularly higher frequencies, there's such a thing as too much resolution.
However, both figure 2 and the table in figure 4 also clearly show that the number of PPO, for every FFT size, increase with each octave, as frequency goes up. Apparently a single FFT size is incapable of producing a constant, fixed number of PPO because FFT is linear whereas our hearing is logarithmic.
It remains to be seen if a single FFT size will do? For now, it's safe to say that 140 PPO can be regarded the maximum required frequency resolution. So what about a minimum required frequency resolution?
Critical bandwidth
With roughly 140 PPO, for pure tones in series, our hearing sense is much more refined compared to, e.g., the equal-tempered scale, with only 12 PPO, used for music in Western cultures. But what about discriminating pitch between pure tones played simultaneously?
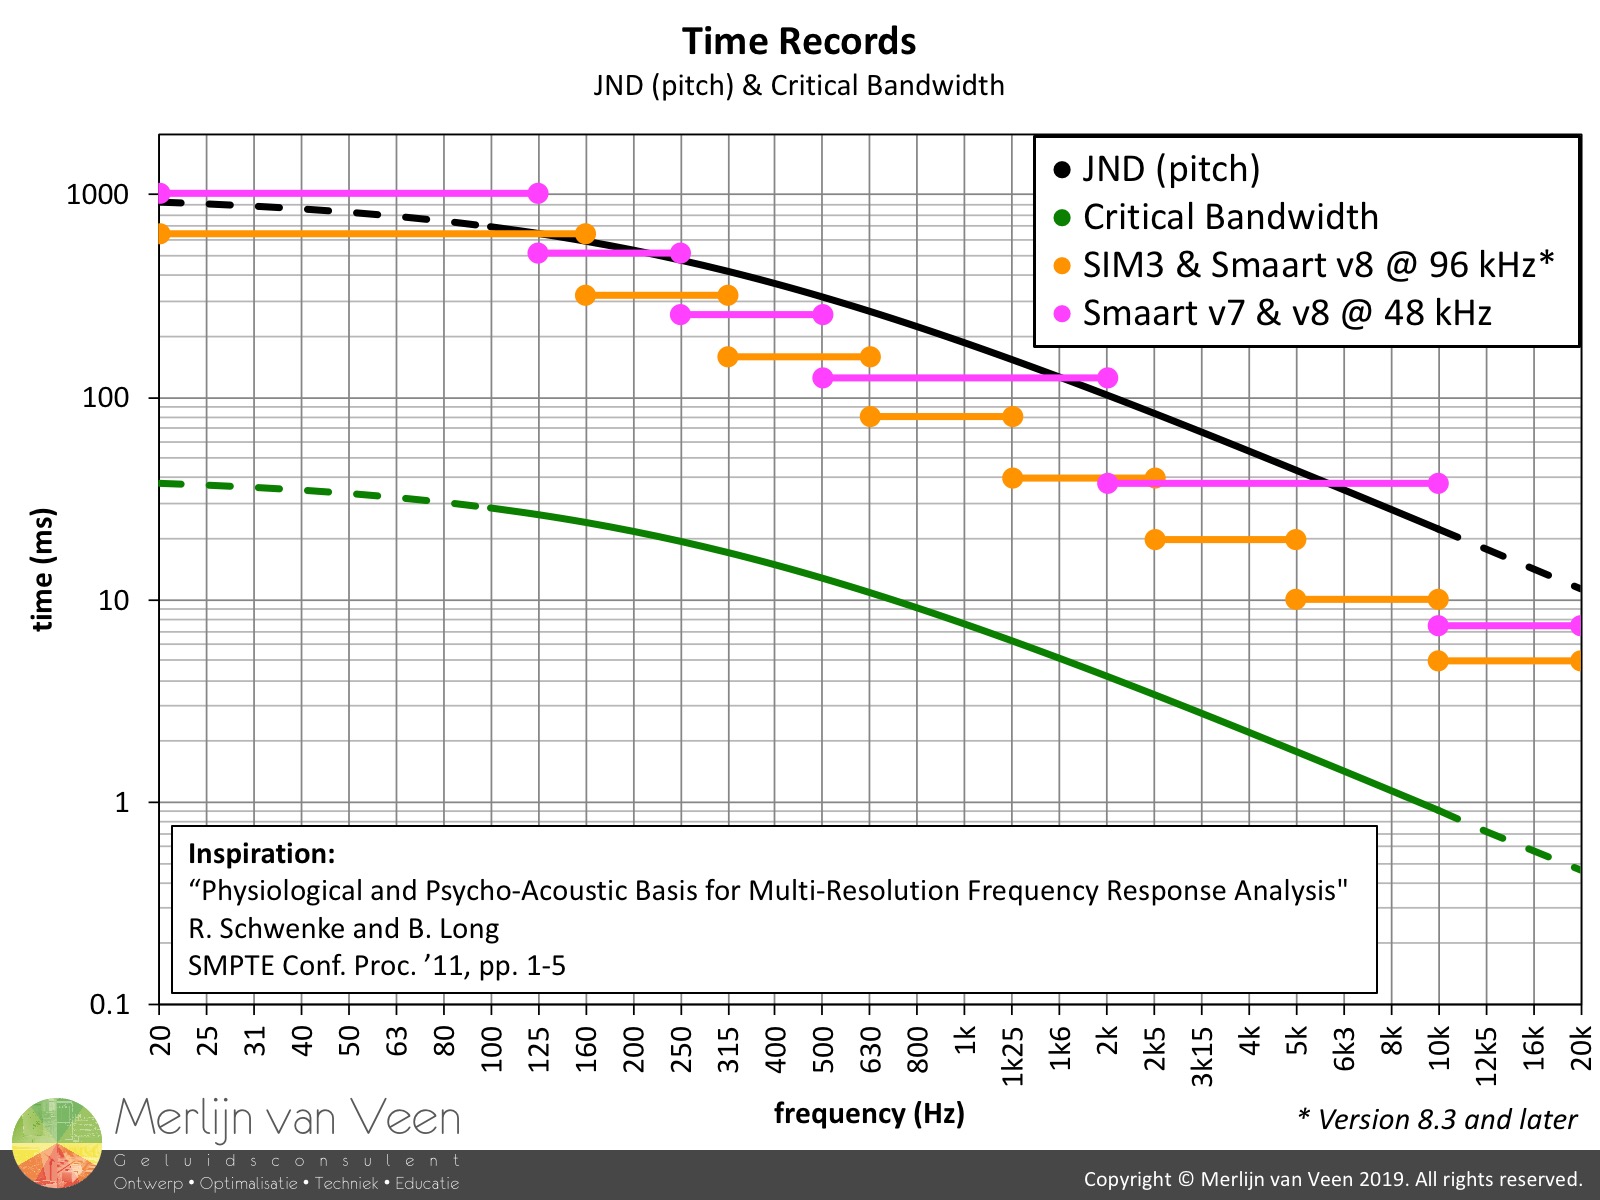
It turns out that when the difference in frequency between two pure tones, played simultaneously, is too small, the second tone will interfere with the perception of the first tone by auditory masking. The auditory frequency-analysis mechanism is unable to resolve inputs whose frequency difference is smaller than critical bandwidth, leaving us incapable of discriminating between separate distinct pitches such as in a music chord.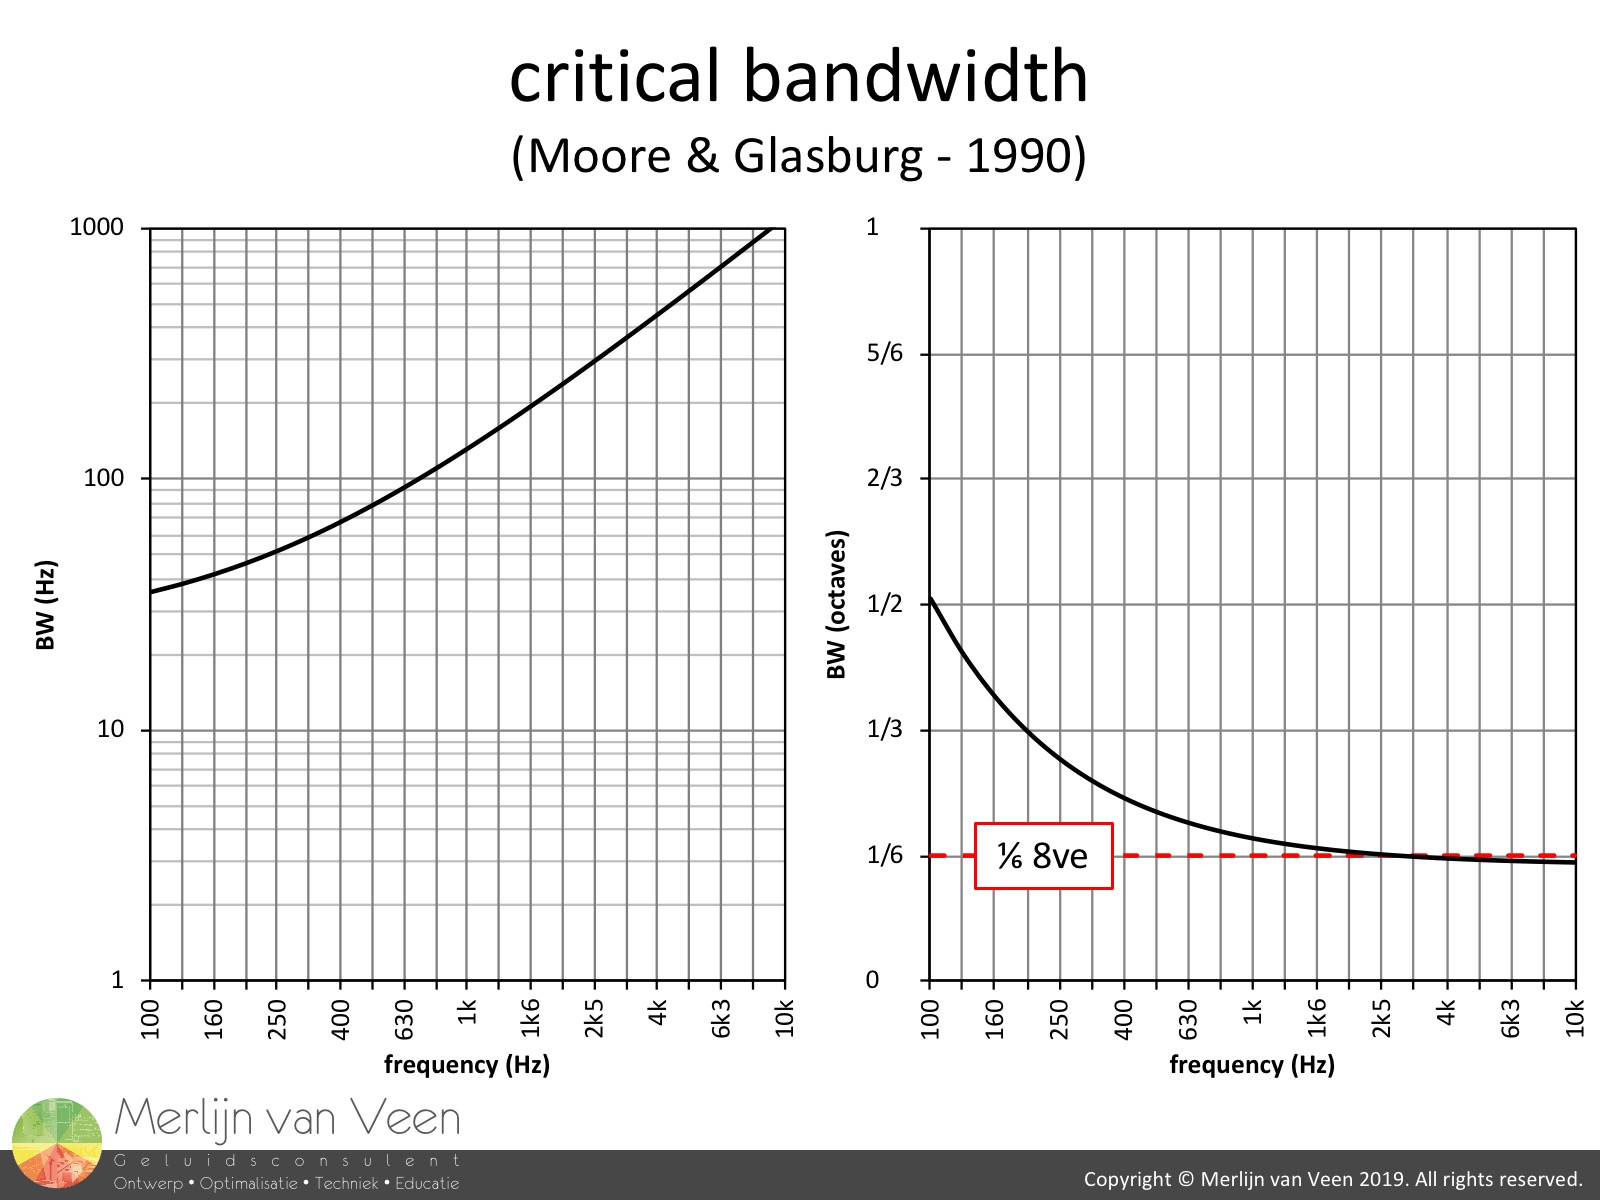 figure 5Figure 5 shows the bandwidth of these critical bands which changes with frequency. From the second chart in figure 5 which shows critical bandwidth expressed in octaves, we can tell that the interval between two pure tones, played simultaneously, needs to be at least one-sixth octave or more. Anything less will result in auditory roughness and beating.
Click here to watch the accompanying YouTube video where I demonstrate critical bandwidth.
Beating
Two pure tones, with slightly different frequencies, interfere in a way that psychophysiologically is perceived as a single pure tone with a periodic change in volume. An amplitude modulated carrier wave. The perceived pitch of such an AM signal is the average frequency of the two original pure tones
\begin{equation}f_{carrier}=\frac{f_1+f_2}{2}\end{equation}
The modulation frequency or "envelope" is half the difference between the frequencies of the two original pure tones
\begin{equation}f_{modulation}=\frac{f_1-f_2}{2}\end{equation}
The audible beat frequency is the difference between the frequencies of the two original pure tones
\begin{equation}f_{beat}=f_1-f_2\end{equation}
This "tremelo"-like phenonom is not perceived as tonal coloration. Instead, it's a temporal or "spatial" sensation which matters for the way we perceive comb filters.
Click here to watch the accompanying YouTube video where I demonstrate beating.
Dissecting comb filters
Comb filters are inevitable whenever there's physical displacement between multiple loudspeakers reproducing the same signal and/or surroundings consisting of specular, reflective surfaces.
The audibility of comb filters is determined by the relative level relationship between multiple instances of the same signal. If levels approach each other the phenomenon is more profound and vice versa.
It's particularly noticeable when walking a room while listening to pink noise and results in strong tonal coloration which is typically described as phasing, flanging or chorusing. Sounds familiar?
Comb filters appear to have audible pitch. The peaks of a comb filter constitute a harmonic series with an apparent pitch equal to the frequency of the first peak (fundamental).
Which pitch you perceive is uniquely defined by your listening position with respect to the sound system and surrounding boundaries, regardless of the program material itself. It's a moving target which typically goes up and down in frequency, as you walk the room, because you're dealing with a purely spatial problem.
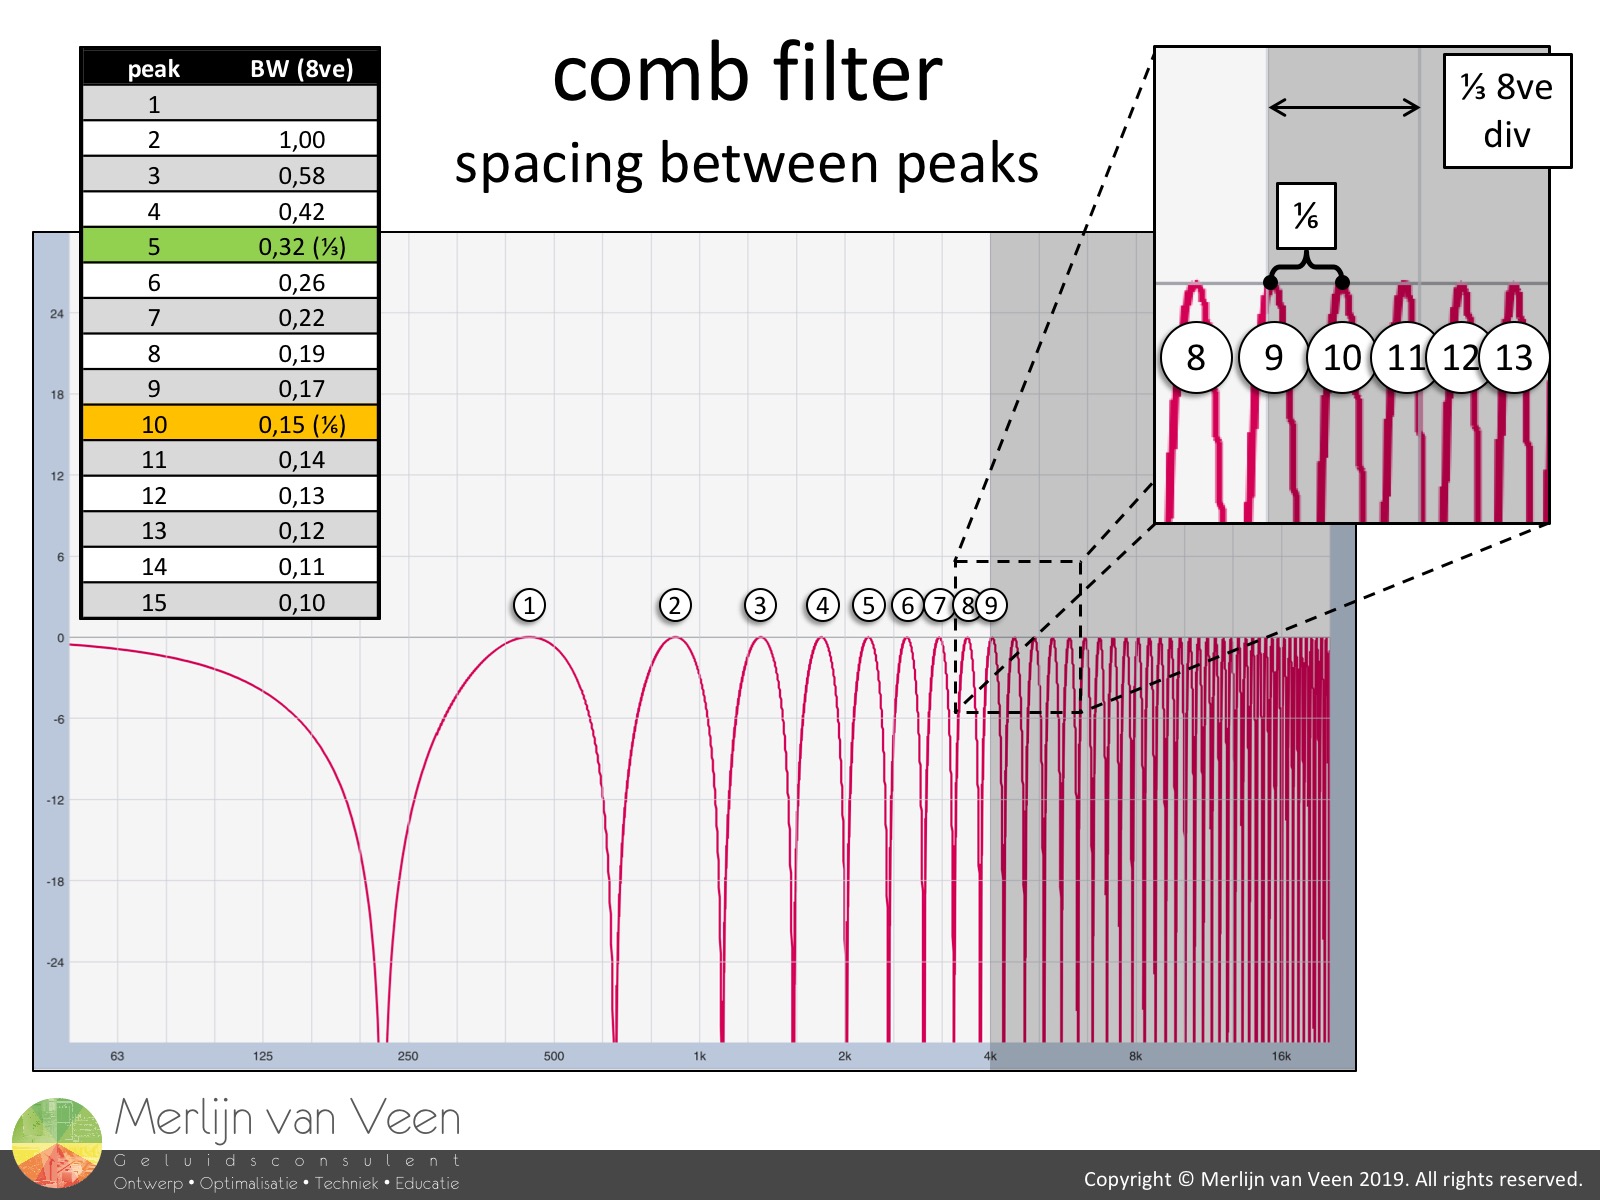 figure 6Figure 6 shows the transfer function of a comb filter. Notice that around the ninth peak, the interval between adjacent peaks becomes less than one-sixth octave (critical bandwidth).
The difference in frequency between these narrow peaks, with a bandwidth of less than one-tenth octave (Q > 15) between the -3 dB (half-power) points, is too small for the auditory frequency‑analysis mechanism to resolve.
From the ninth peak and up, the remainder of the comb filter is no longer perceived as strong tonal coloration but becomes spatial (temporal) in nature.
Stable summation
"System engineering is coordinating interactions with a goal"
- Jamie Anderson -
These interactions consist of speaker-to-speaker and speaker-to-room interaction. As long as no one starts moving loudspeakers or redecorating the room with a wrecking ball, the interactions are stable.
Typically, the goal is to deliver the sonic experience at front of house (where part of the artistic decision-making process takes place) to the rest of the audience at similar levels, sounding the same, with the least amount of destructive interference.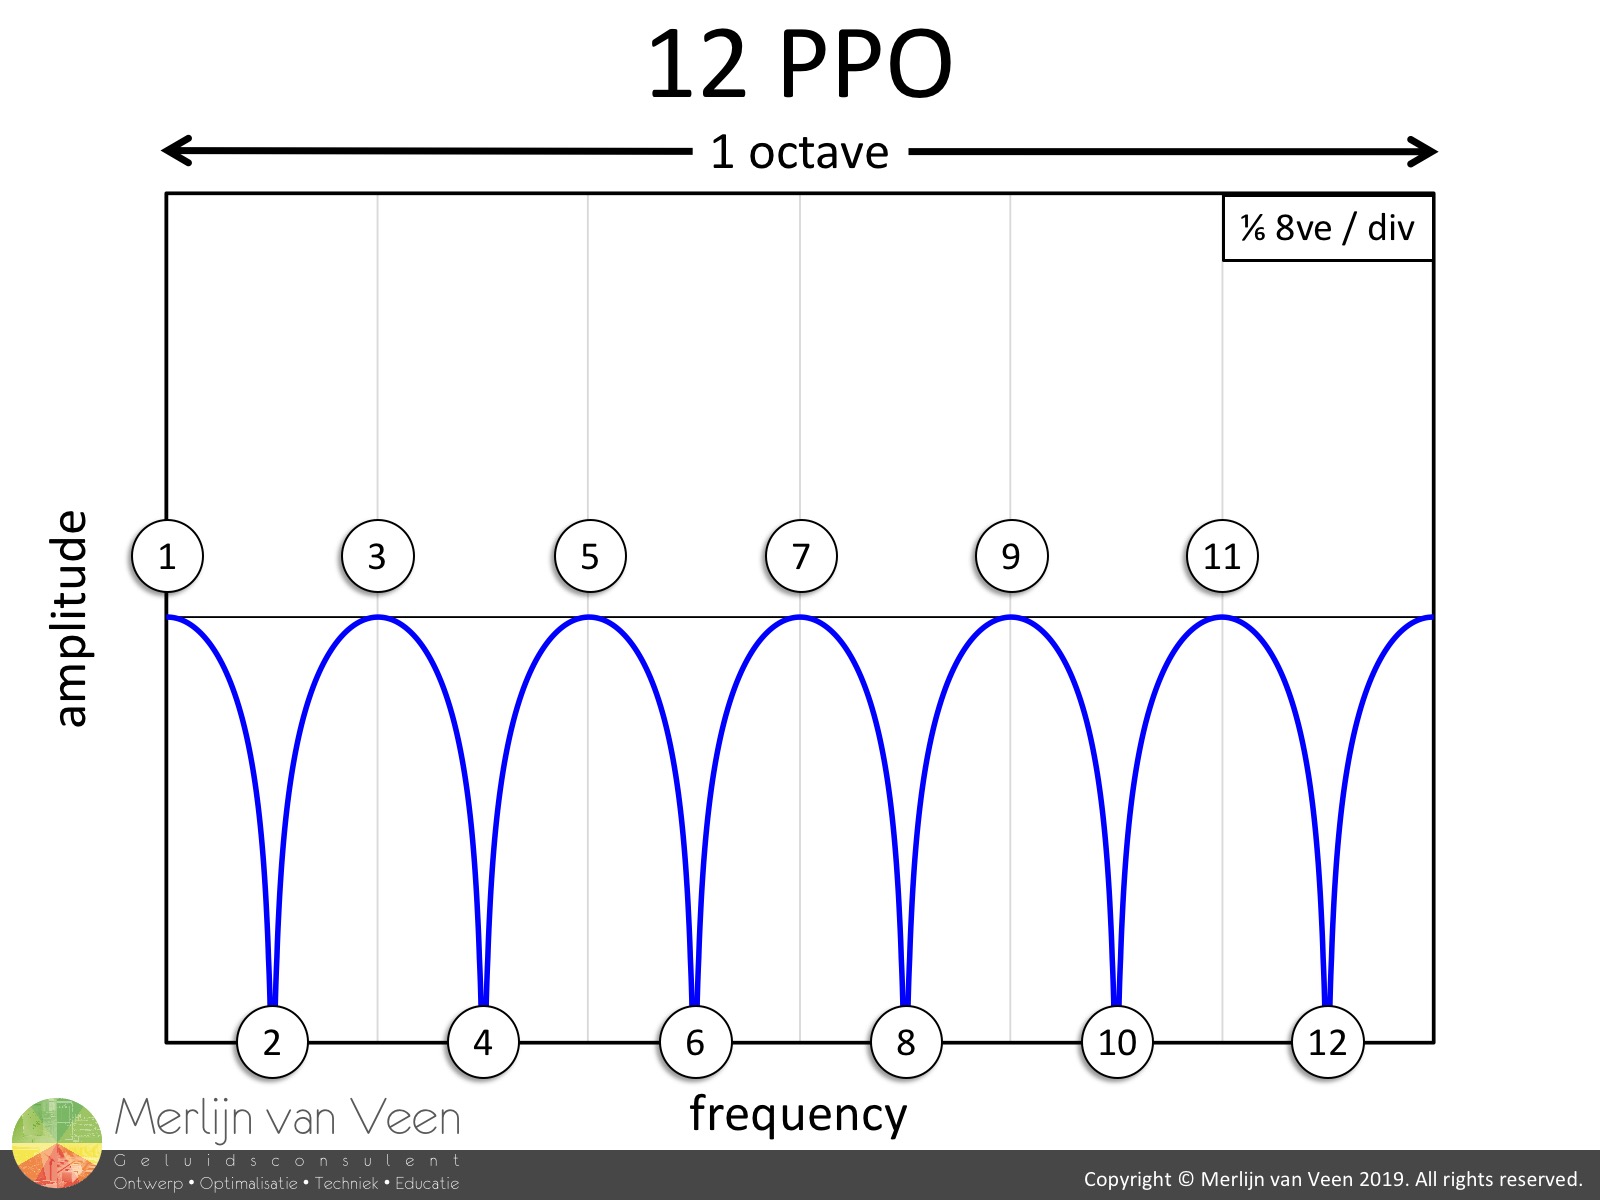 figure 7However, since interference is inevitable, it's within our interest to identify with confidence, any interference that manifests itself as strong tonal coloration, i.e., peaks separated by at least one-sixth octave or more, so we can decide what to do about it.
One octave offers room for six peaks and cancels, spaced one-sixth ocatve appart (figure 7). In order to identify these twelve points in total, it takes at least 12 PPO.
Preliminary conclusion
This concludes part one of this series of articles and we can carefully draw a preliminary conclusion. If it's our interest to provide all audience members with the same tone, the analyzer should have sufficient resolution in order for us to identify tonal coloration (among others).
Critical bandwidth suggests that this requires at least 12 PPO. It remains to be seen whether this will suffice, but for now let's consider this the preliminary minimum frequency resolution required.
On the other hand, JND (pitch) suggests that resolution in excess of 140 PPO, exceeds our ability to detect pitch differences which sets the preliminary maximum frequency resolution.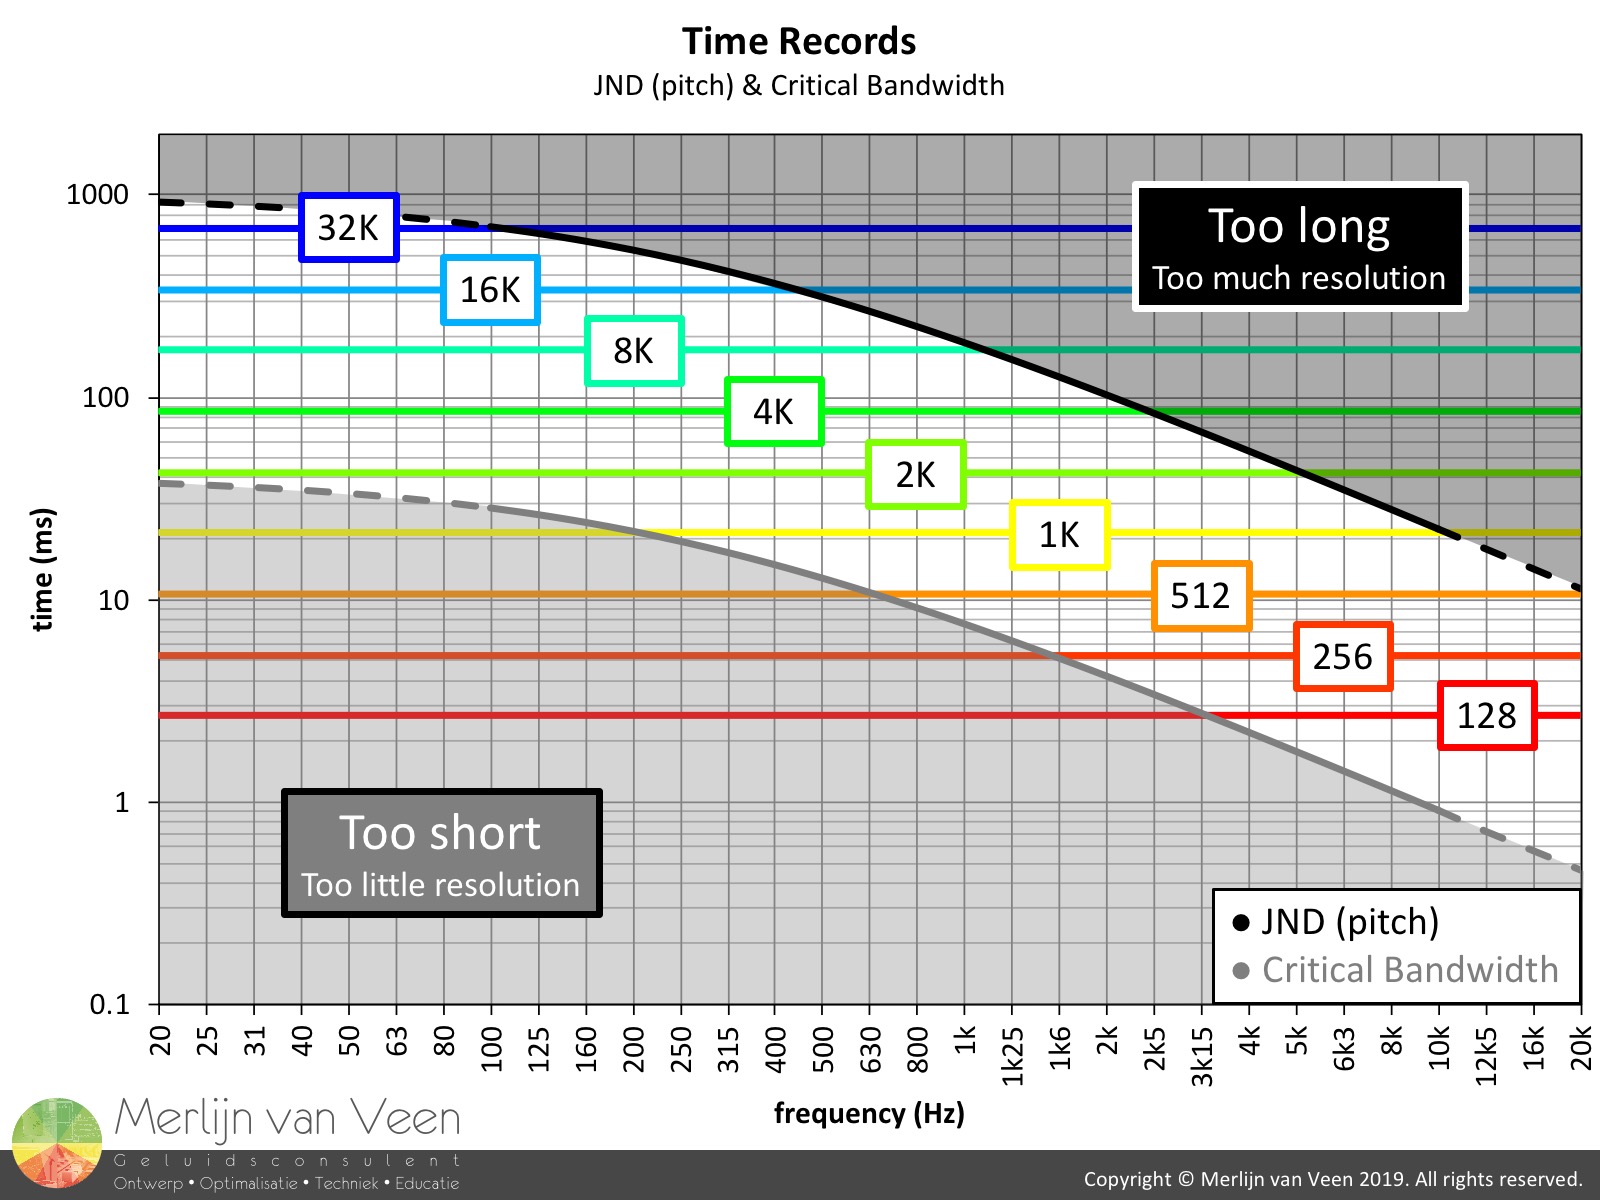 figure 8Looking at figure 8, it's readily apparent that one FFT size, for the entire audible spectrum, won't suffice. A short FFT size will provide sufficient resolution at high frequencies but fail to capture low frequencies, let alone with sufficient resolution.
Conversely, a large FFT size will capture the low frequencies in exchange for way too much resolution at high frequencies.
One FFT size won't do. This is one reason why modern analyzers resort to multiple time records. The next time we'll discuss accuracy and "over-sampling" as well as echo perception and much more. For now, stay tuned!
Accompanying YouTube video
References:
- “Physiological and Psycho-Acoustic Basis for Multi-Resolution Frequency Response Analysis"
R. Schwenke and B. Long
SMPTE Conf. Proc. ’11, pp. 1-5 - Wikipedia: Critical band
- Wikipedia: Beat (Acoustics)
- Wikipedia: Equivalent Rectangular Bandwidth
- "Sound Systems: Design and Optimization"
Bob McCarthy
Ch. "Perception" & Ch. "Examination"