
 figure 1I can tell from my seminars that the impulse response or simply IR, remains an abstract to many. But, if you think of the impulse response literally as an audio track in a Digital Audio Workstation (DAW) like Pro Tools, Logic or Reaper, it might come more naturally in the future.
Let's start with Bob McCarthy's excellent explanation.
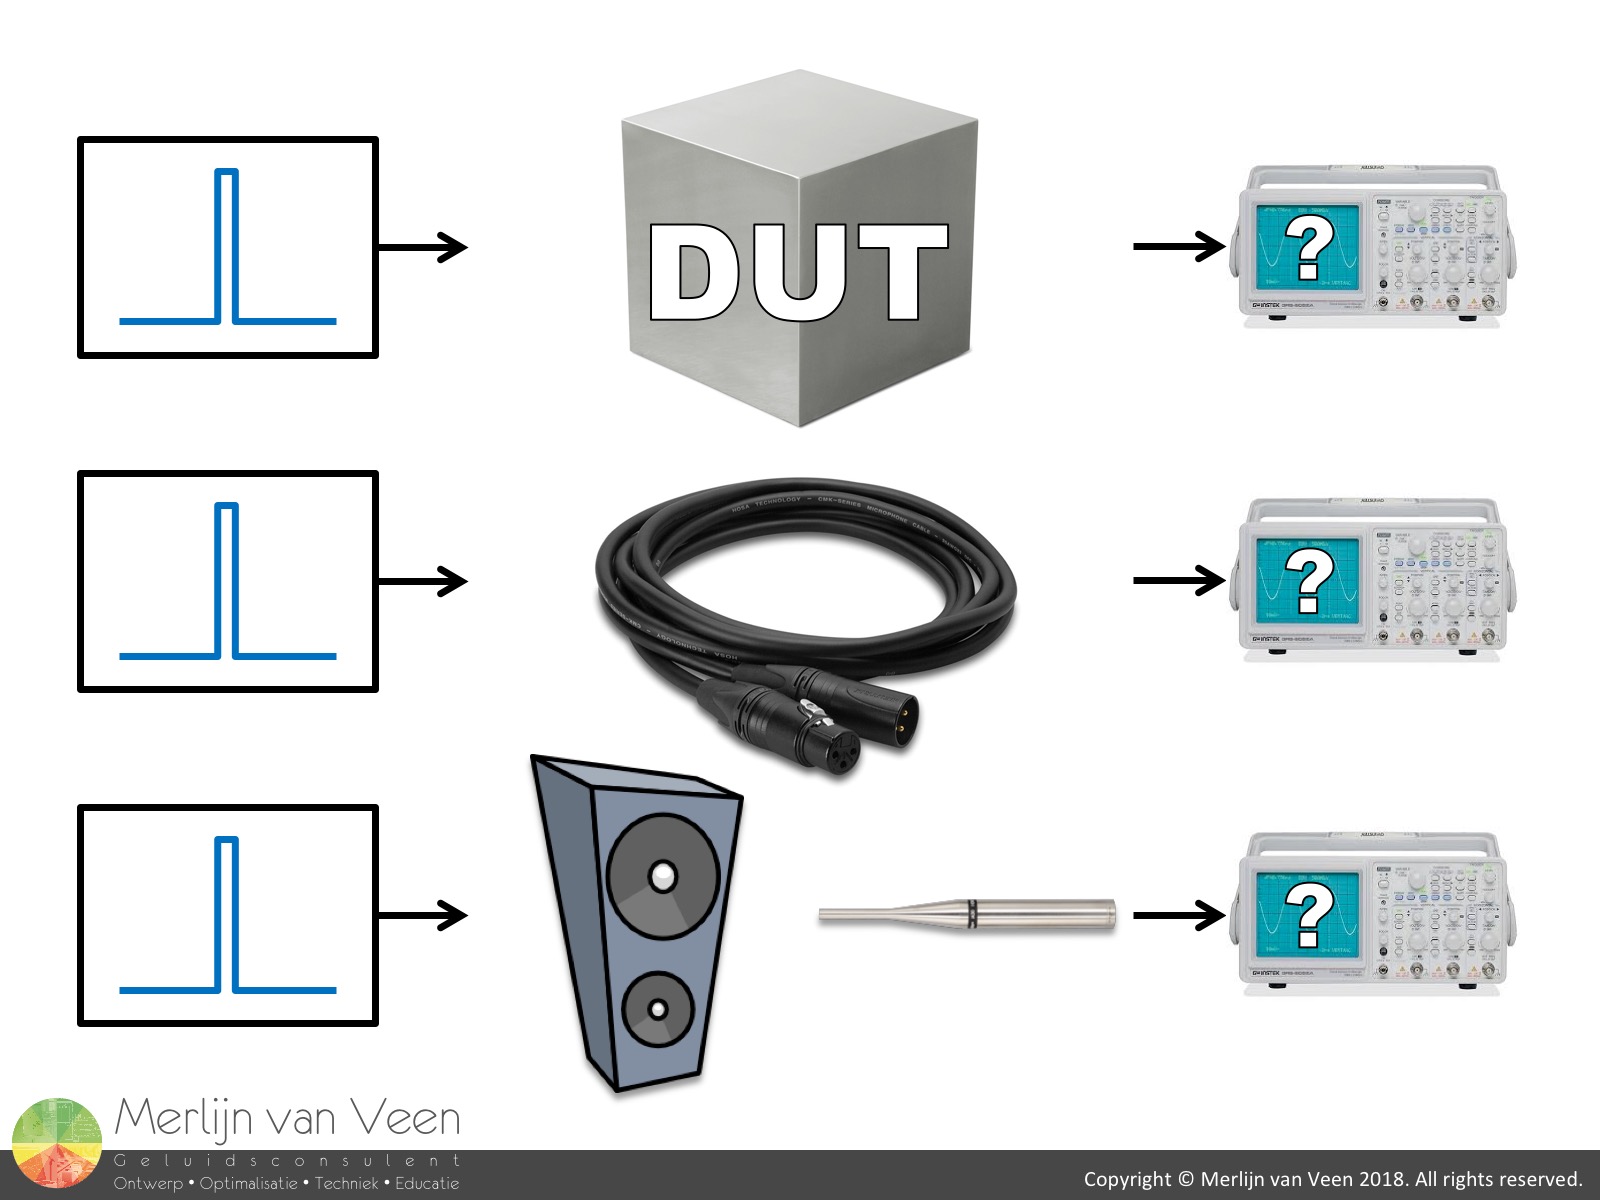
The impulse response describes the answer to a hypothetical question:
"What would this Device Under Test (DUT) look like on an oscilloscope when driven with an (im)pulse?" (figure 1)
An oscilloscope displays audible sound as Alternating Current (AC) with positive and negative polarity where the ideal pulse (known as a Dirac pulse) would look like an instantaneous rise followed immediately by a fall without overshoot. It contains every audible frequency, lasting for exactly one cycle, starting at the same time and level.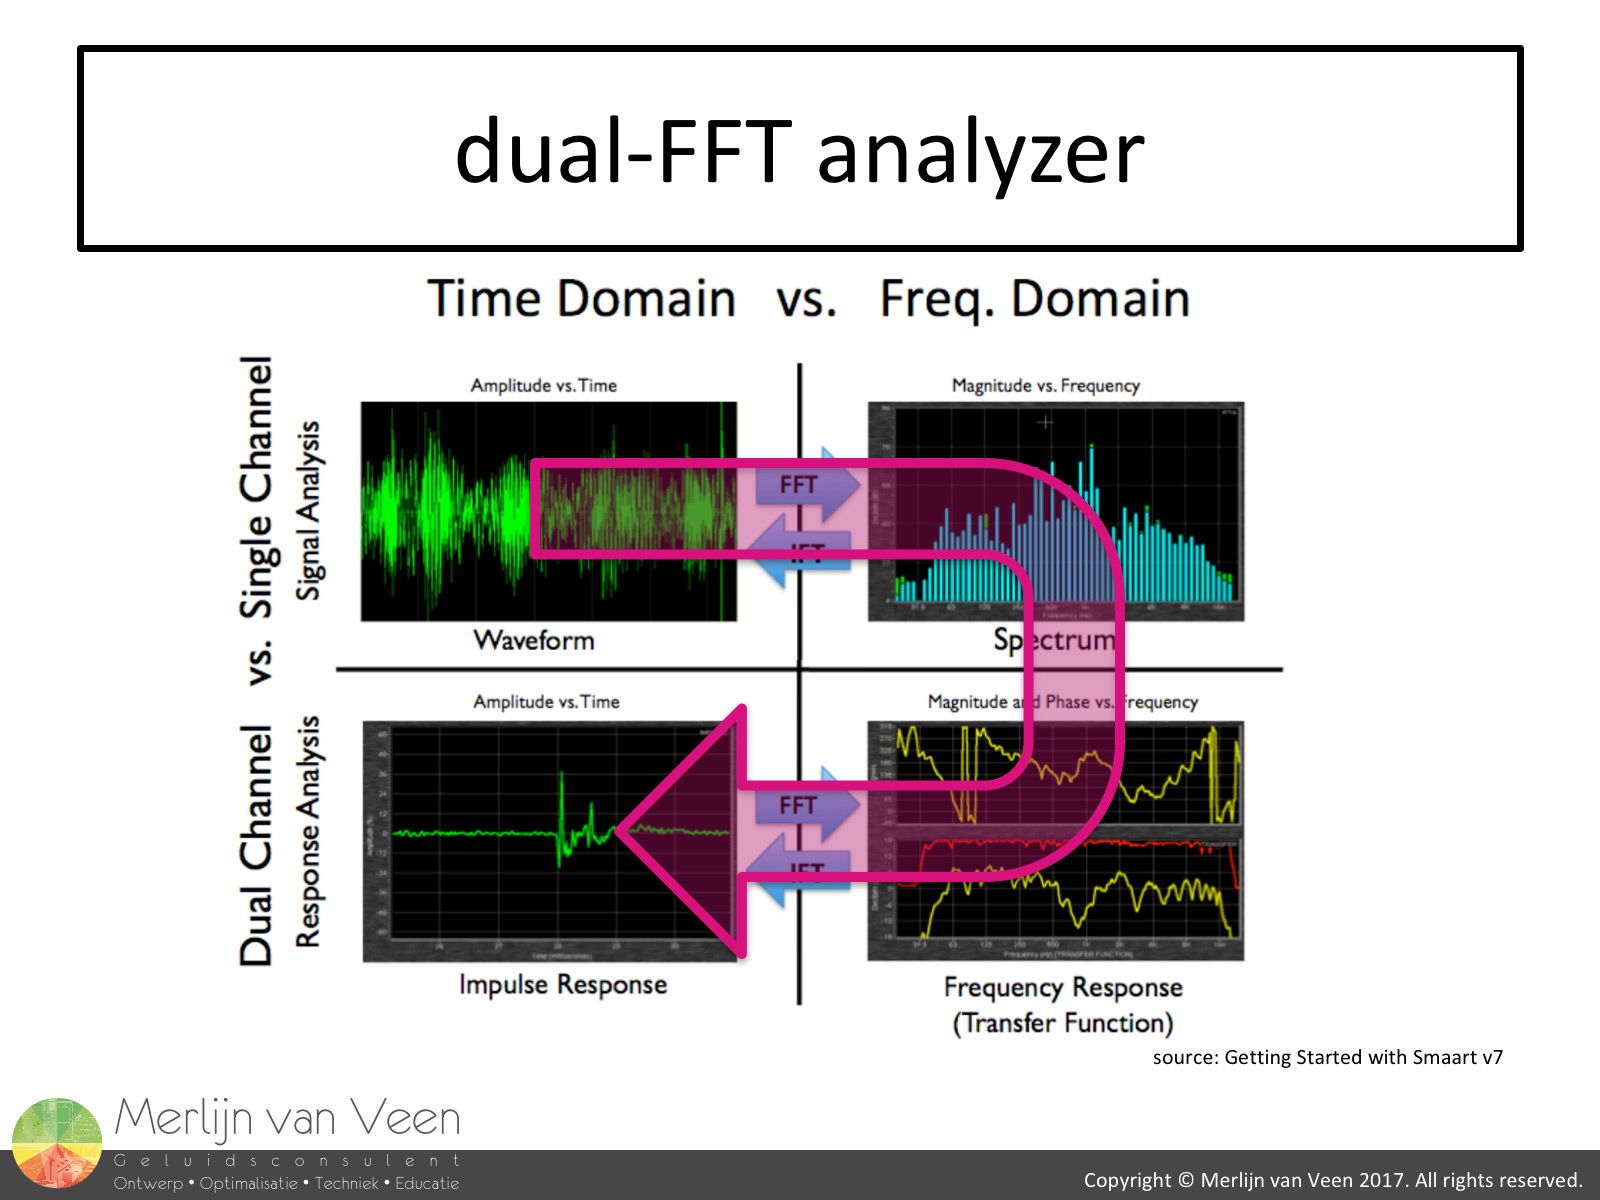 figure 2Dual-channel FFT analyzers can obtain an IR either directly or compute it as a second generation transfer function from the frequency domain by means of the Inverse Fourier Transform (figure 2).
This allows us to calculate the IR mathematically rather than having to fire an actual starting pistol, popping a balloon or clapping our hands. Time- and frequency-domain are reciprocal. They're joined at the hip like two sides of the same coin. It's exactly the same story told from different points of view.
If we introduce such a transient signal, e.g., a snare drum hit, into a microphone cable (a near-perfect conduit for our application), we expect it to come out at the other end instantaneously without any meaningful changes in time and/or level (figure 1 - example 2). But what happens if we introduce a pulse into a DUT exhibiting a gratuitous amount of phase shift like a loudspeaker or, in this instance, a subwoofer (figure 1 - example 3)?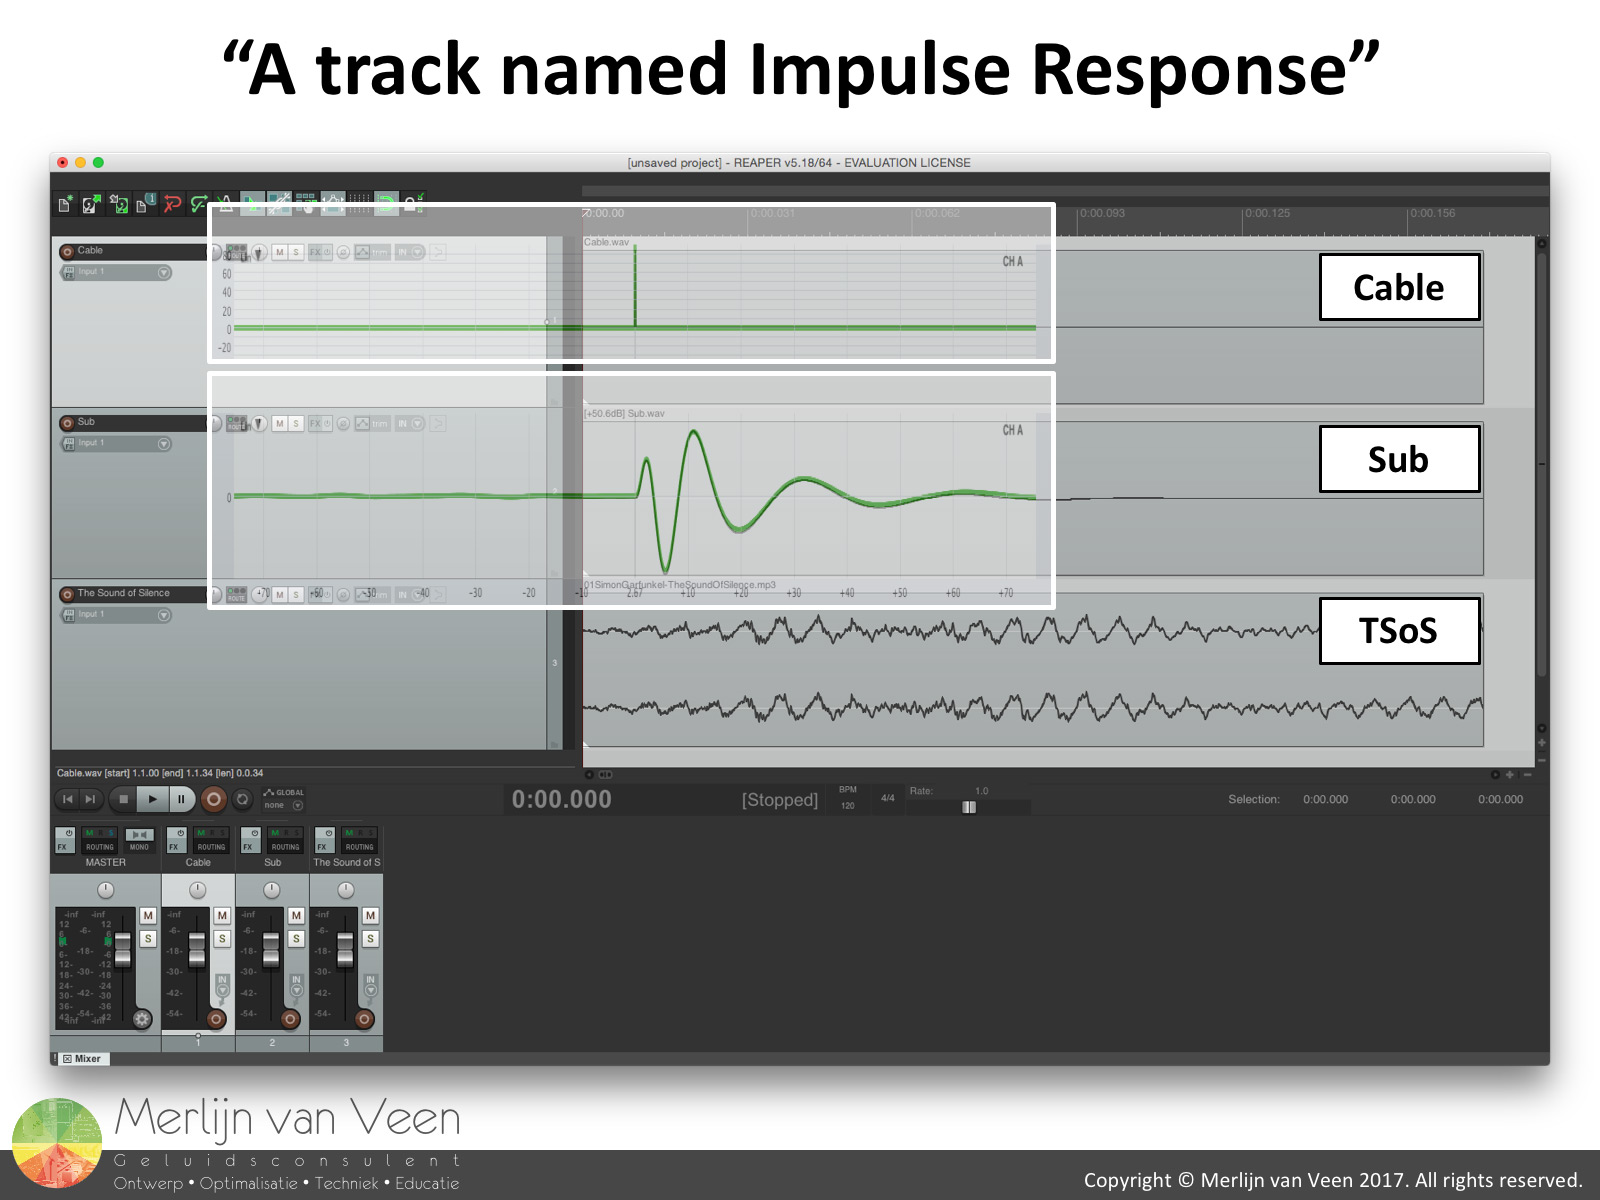 figure 3Figure 3 shows a DAW (Reaper) with 3 tracks. Track 1 contains the IR of a microphone cable and track 2 the IR of a typical vented subwoofer with direct radiator(s) whose level has been normalized solely for visual purposes.
Band-limiting a loudspeaker, like a subwoofer, reduces the amplitude of its IR which makes the waveform hard to see. Particularly on the linear amplitude scale of a DAW or oscilloscope. In order to better understand why the IR of a subwoofer looks the way it does, please consult this article.
I've deliberately delayed both responses by 10 ms so that their waveforms don't appear directly at the beginning of their respective tracks. Track 3 shows an arbitrary fragment of "The Sound of Silence" by Simon and Garfunkel (pun intended) to emphasize the waveform concept.
I've superimposed these very same IR's, as observed in an analyzer, on top of tracks 1 and 2 respectively. When we conduct transfer function analysis we use internal delay to synchronize the two channels, thereby compensating for propagation delay (latency) and/or time-of-flight. Notice here that this practice acts like the actual playback position in a DAW.
If we scrub through the pulse in our microphone cable (track 1) all audible frequencies will be heard instantaneously at the peak, i.e., a single-sample event. By contrast, the inherent phase shift of our subwoofer (track 2) has stretched the pulse out over time and scrubbing through its track will typically let us hear only a single subwoofer frequency at a time. Like sliding down the neck of a fretless bass guitar from high to low.
For those that wonder why loudspeakers exhibit phase shift to begin with, let's briefly pause and address that first.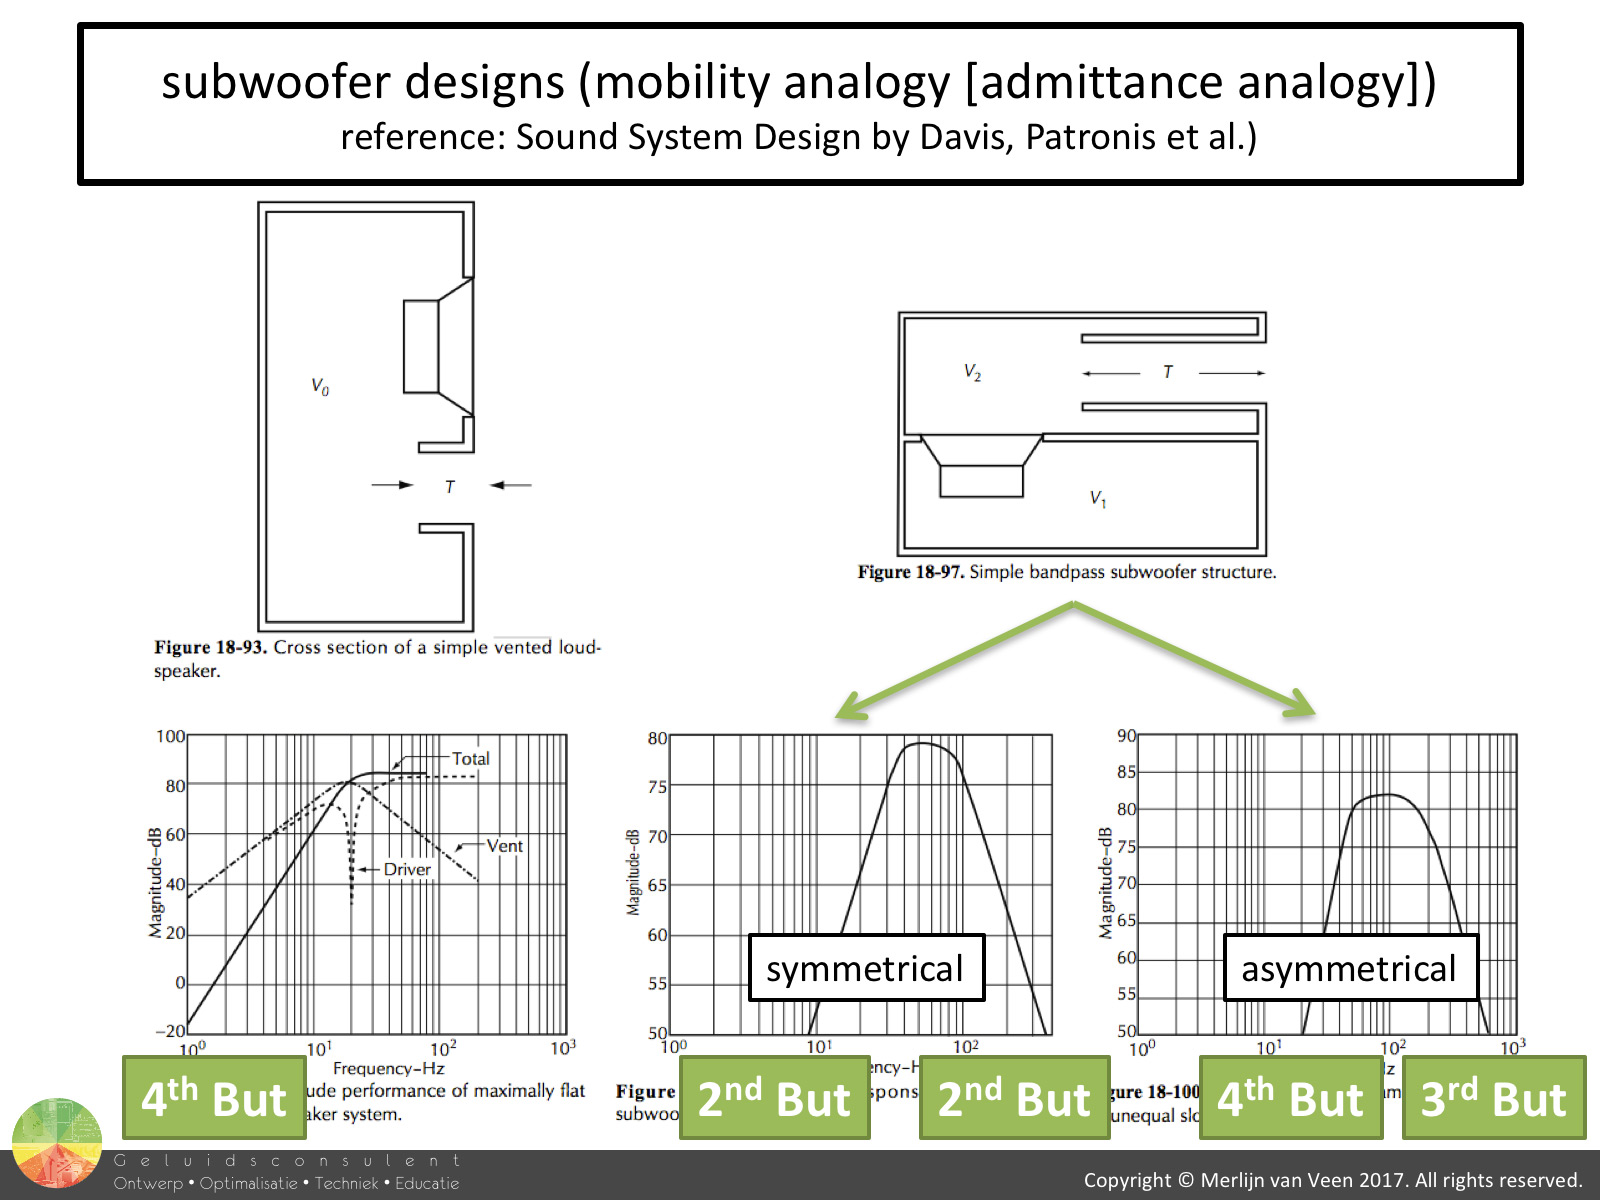 figure 4
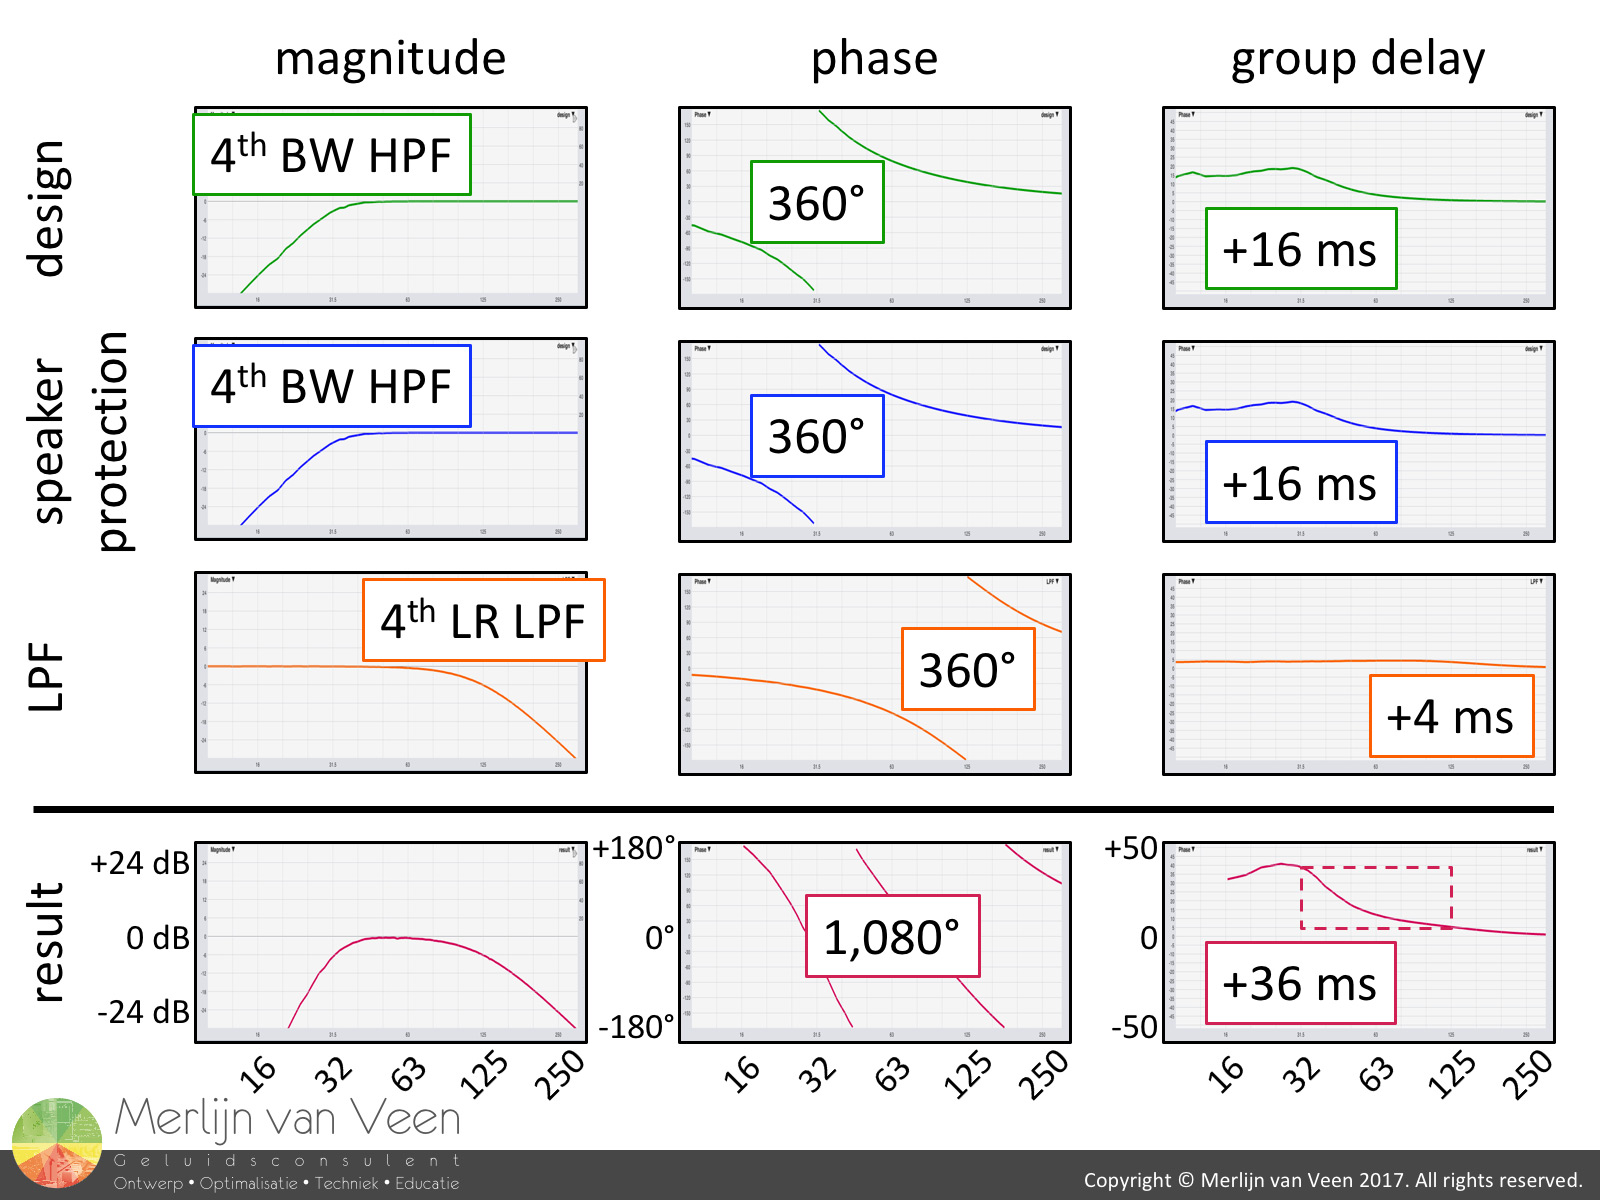 figure 5By means of mechanical-electrical analogies, properties like friction, mass and stiffness (compliance) can be modeled in RLC-circuits using resistors, coils and capacitors of which transfer functions can be calculated and measured.
In case of a vented enclosure (figure 4 - left example), enclosure-design alone (wood, screws and glue) will typically cause fourth order high-pass filter behavior, including the inherent 360° of phase shift, at the tuning frequency where port and direct radiator resonate. No electronics involved!
The vent or port however, is a double-edged sword. It extends low frequencies but at the same time enables the driver to "breathe" through the port which until somebody bored a hole in the baffle was more challenging (trapped air - bicycle pump). Therefor, a subsonic electronic high-pass filter to prevent over-excursion (figure 5 - second row) or alternative ways of loudspeaker protection becomes mandatory.
To finish the subwoofer in this example, its bandwidth needs to be reduced to the intended range of operation. For vented enclosures (unlike band-pass designs), this is typically achieved by means of an electronic low-pass filter (figure 5 - third row). Upon completion, the compound phase shift typically equals 3 cycles (1,080°) or more, throughout a mere 2-octave wide interval (figure 5 - fourth row)!
This accumulated phase shift prohibits real loudspeakers from acting like microphone cables, free from any phase shift. And everybody wonders why a subwoofer is typically incapable of delivering more than a single frequency at a time?
With that in mind, let's continue the original story.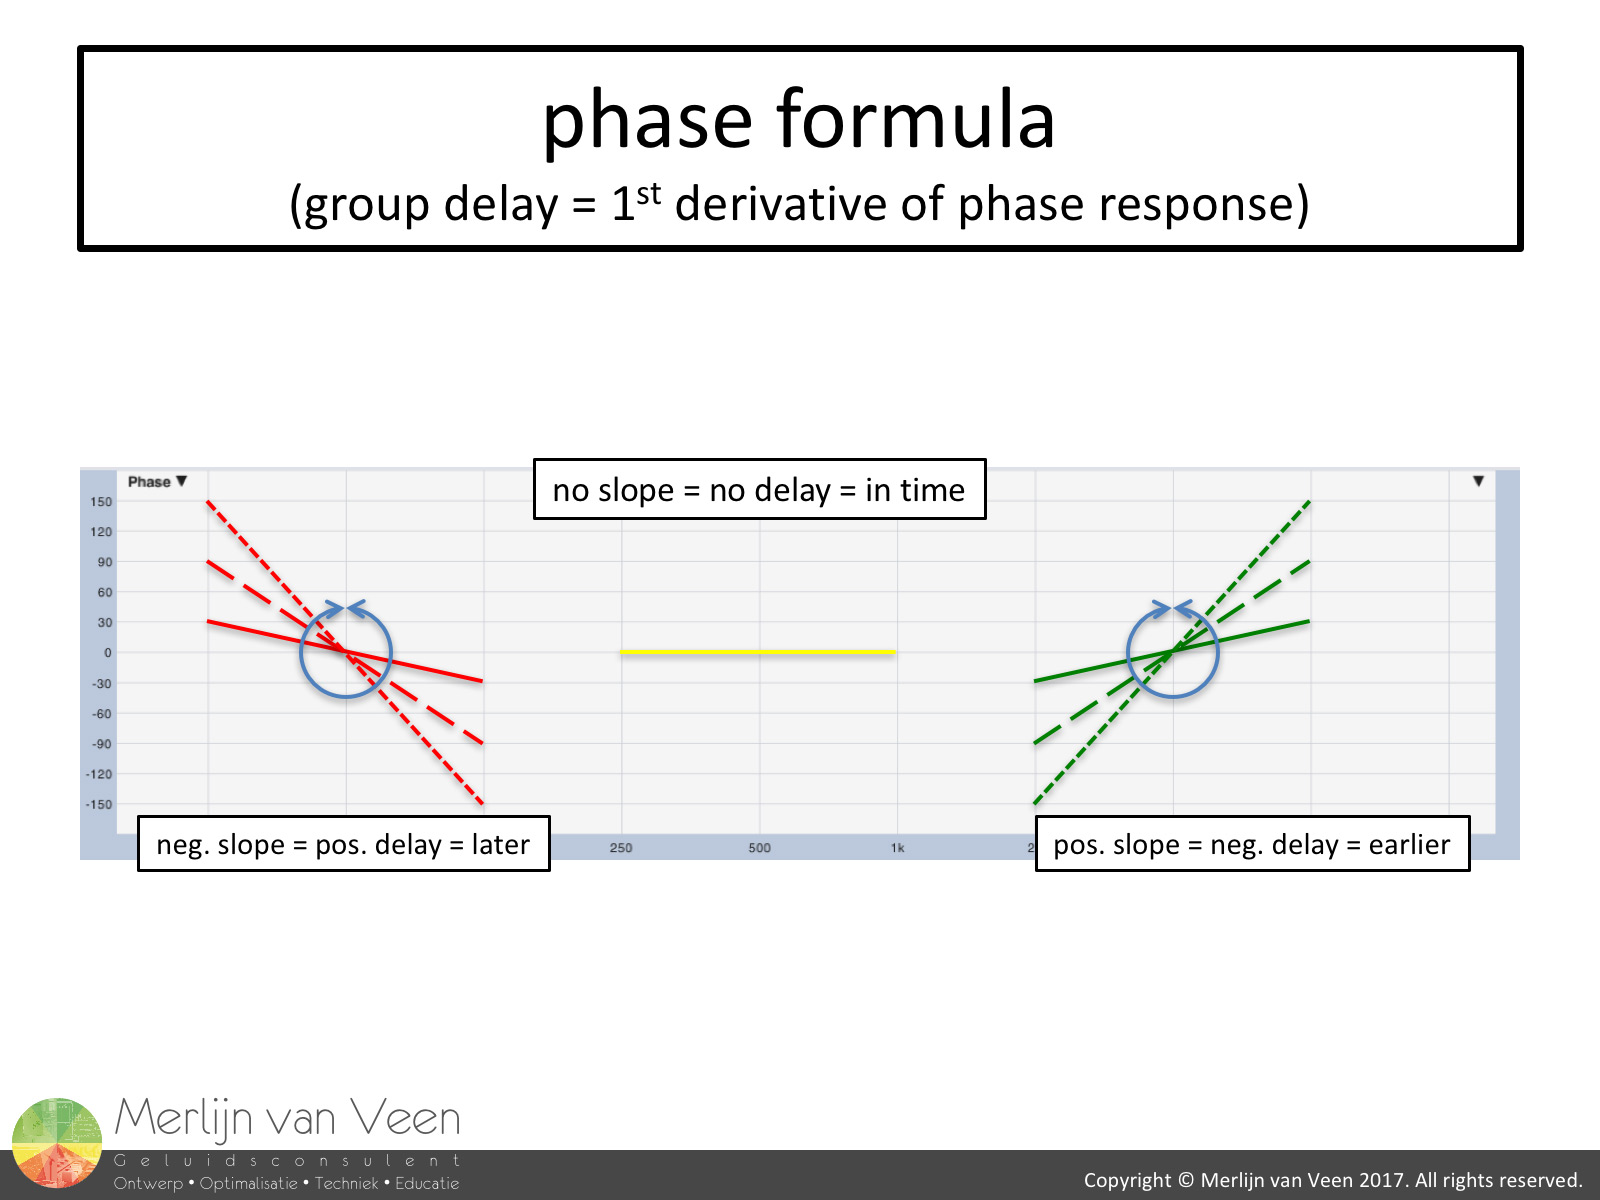 figure 6
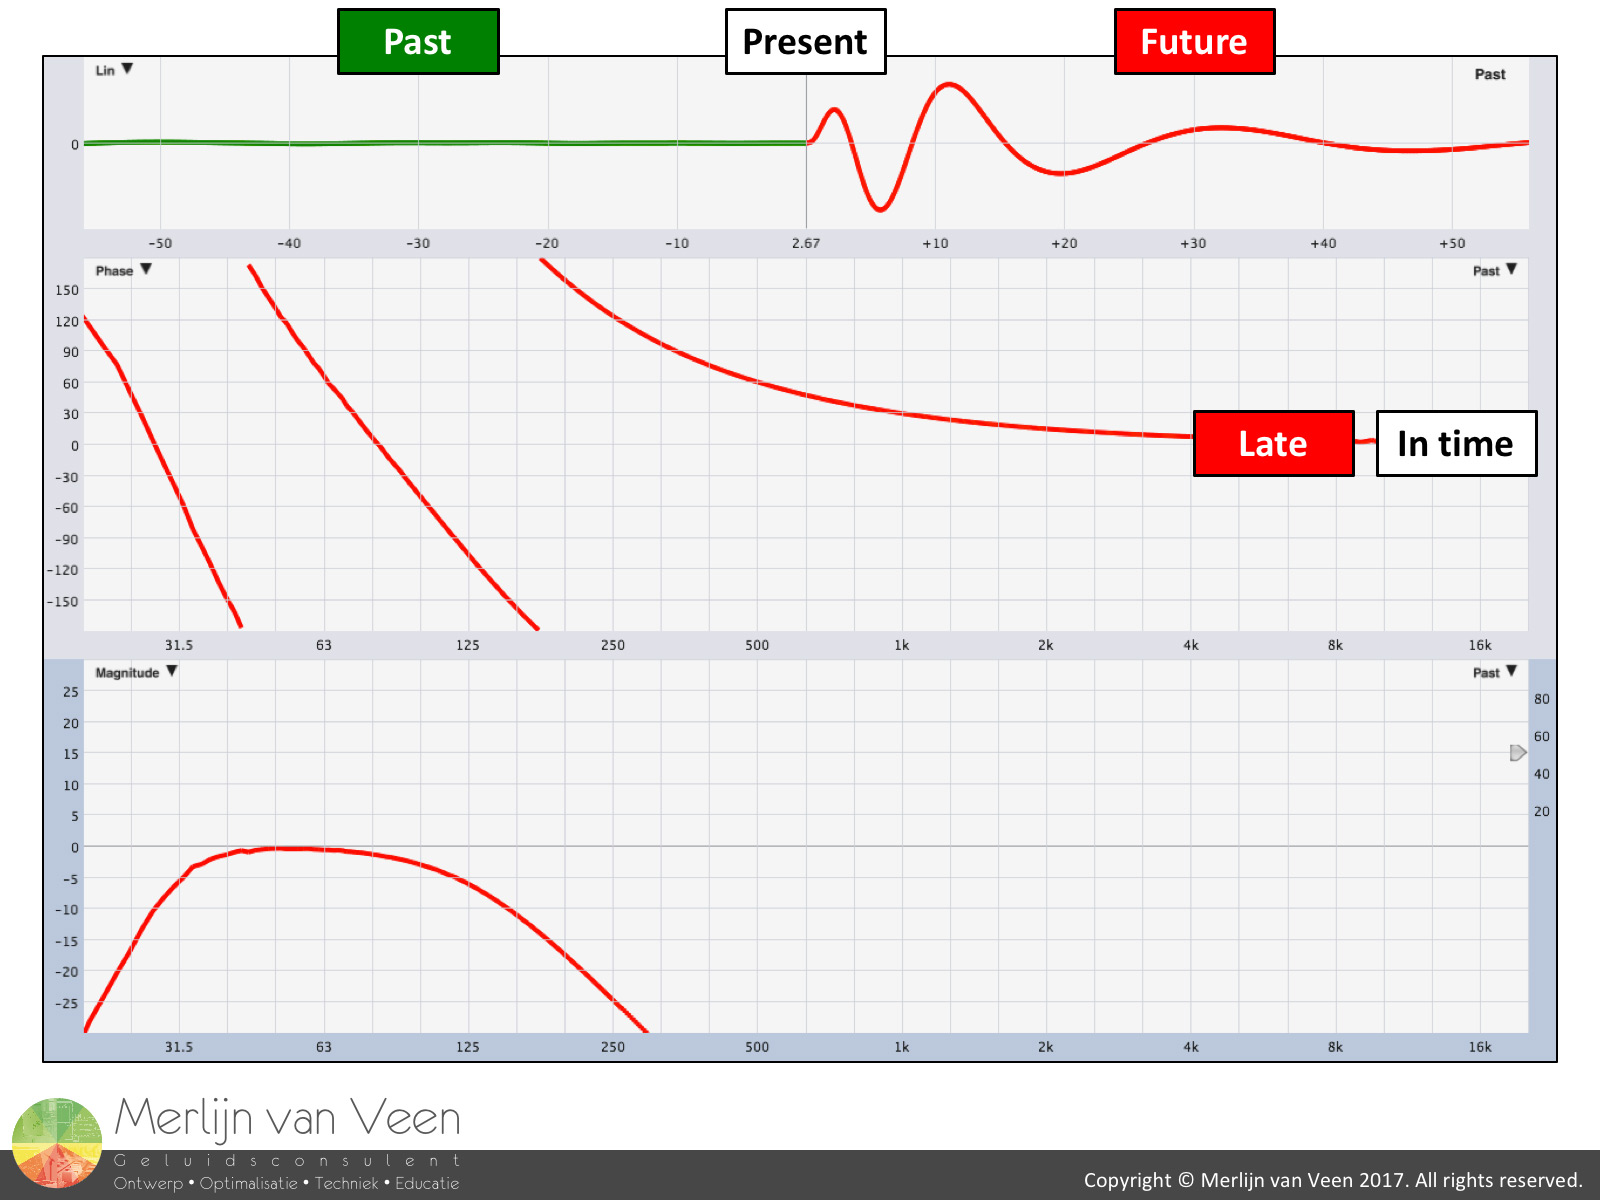 gallery 1
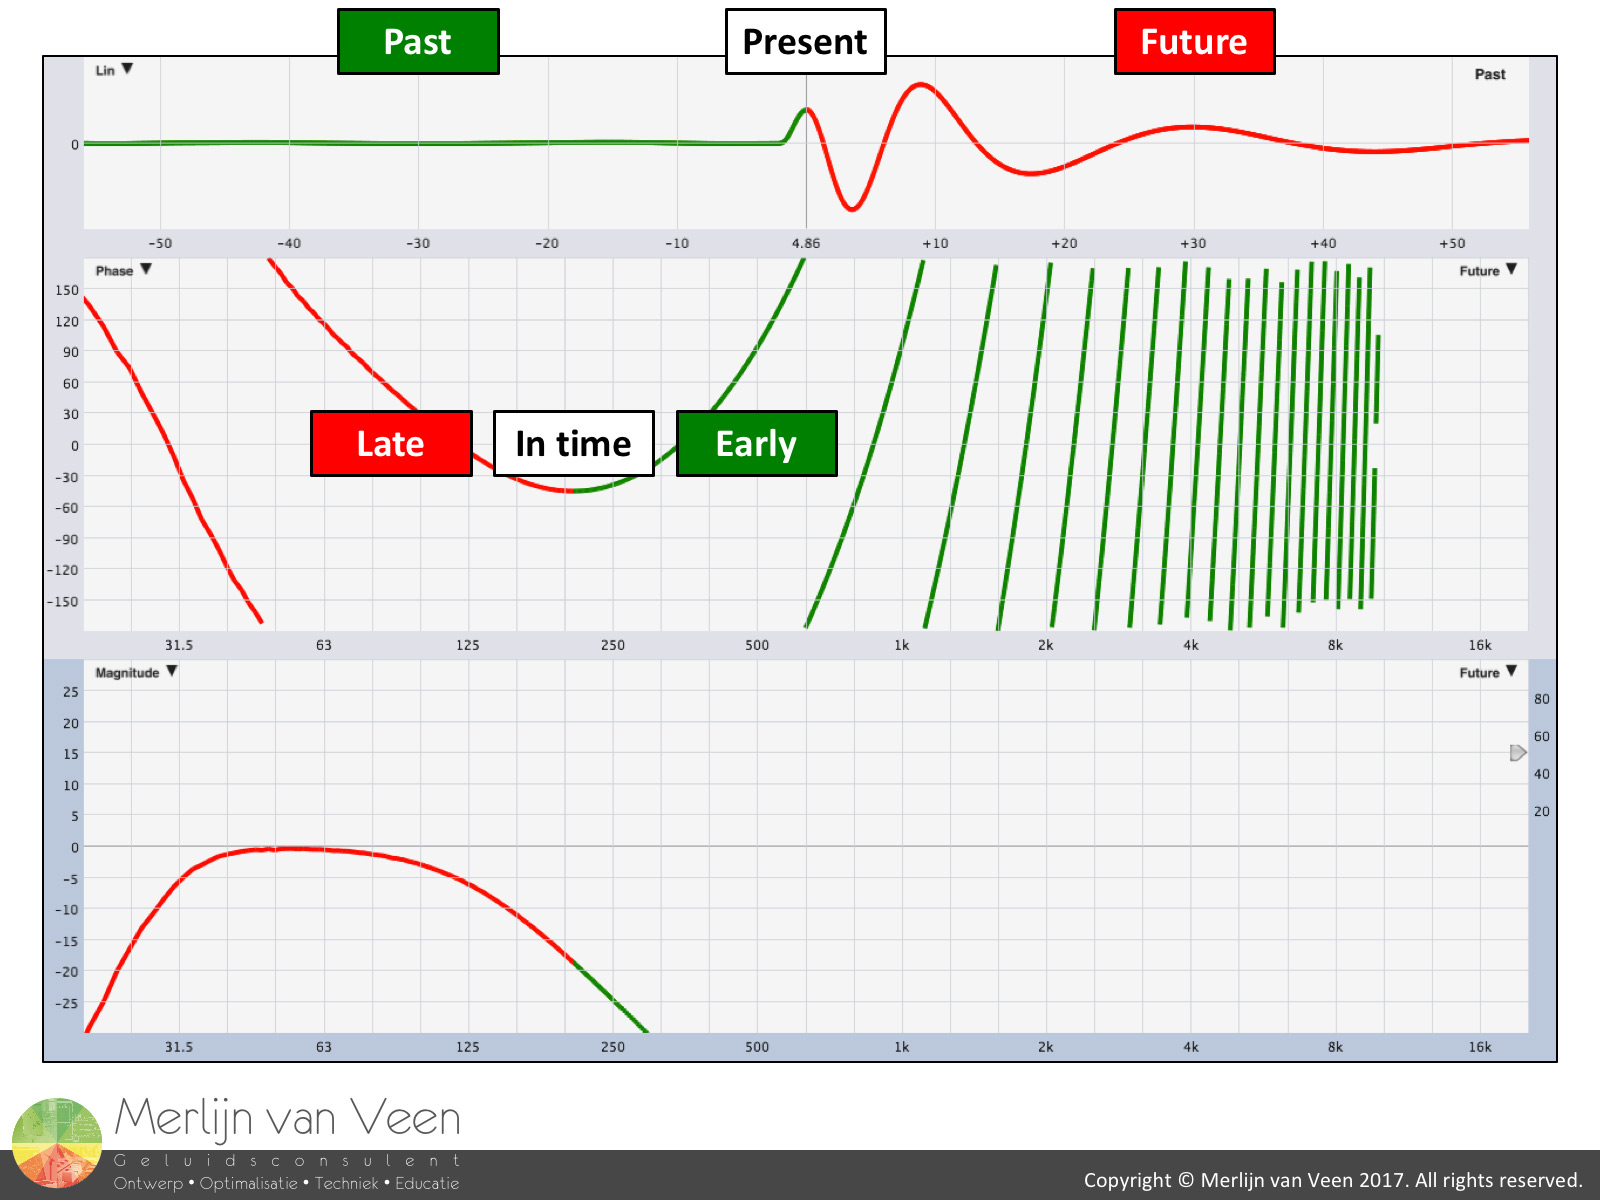
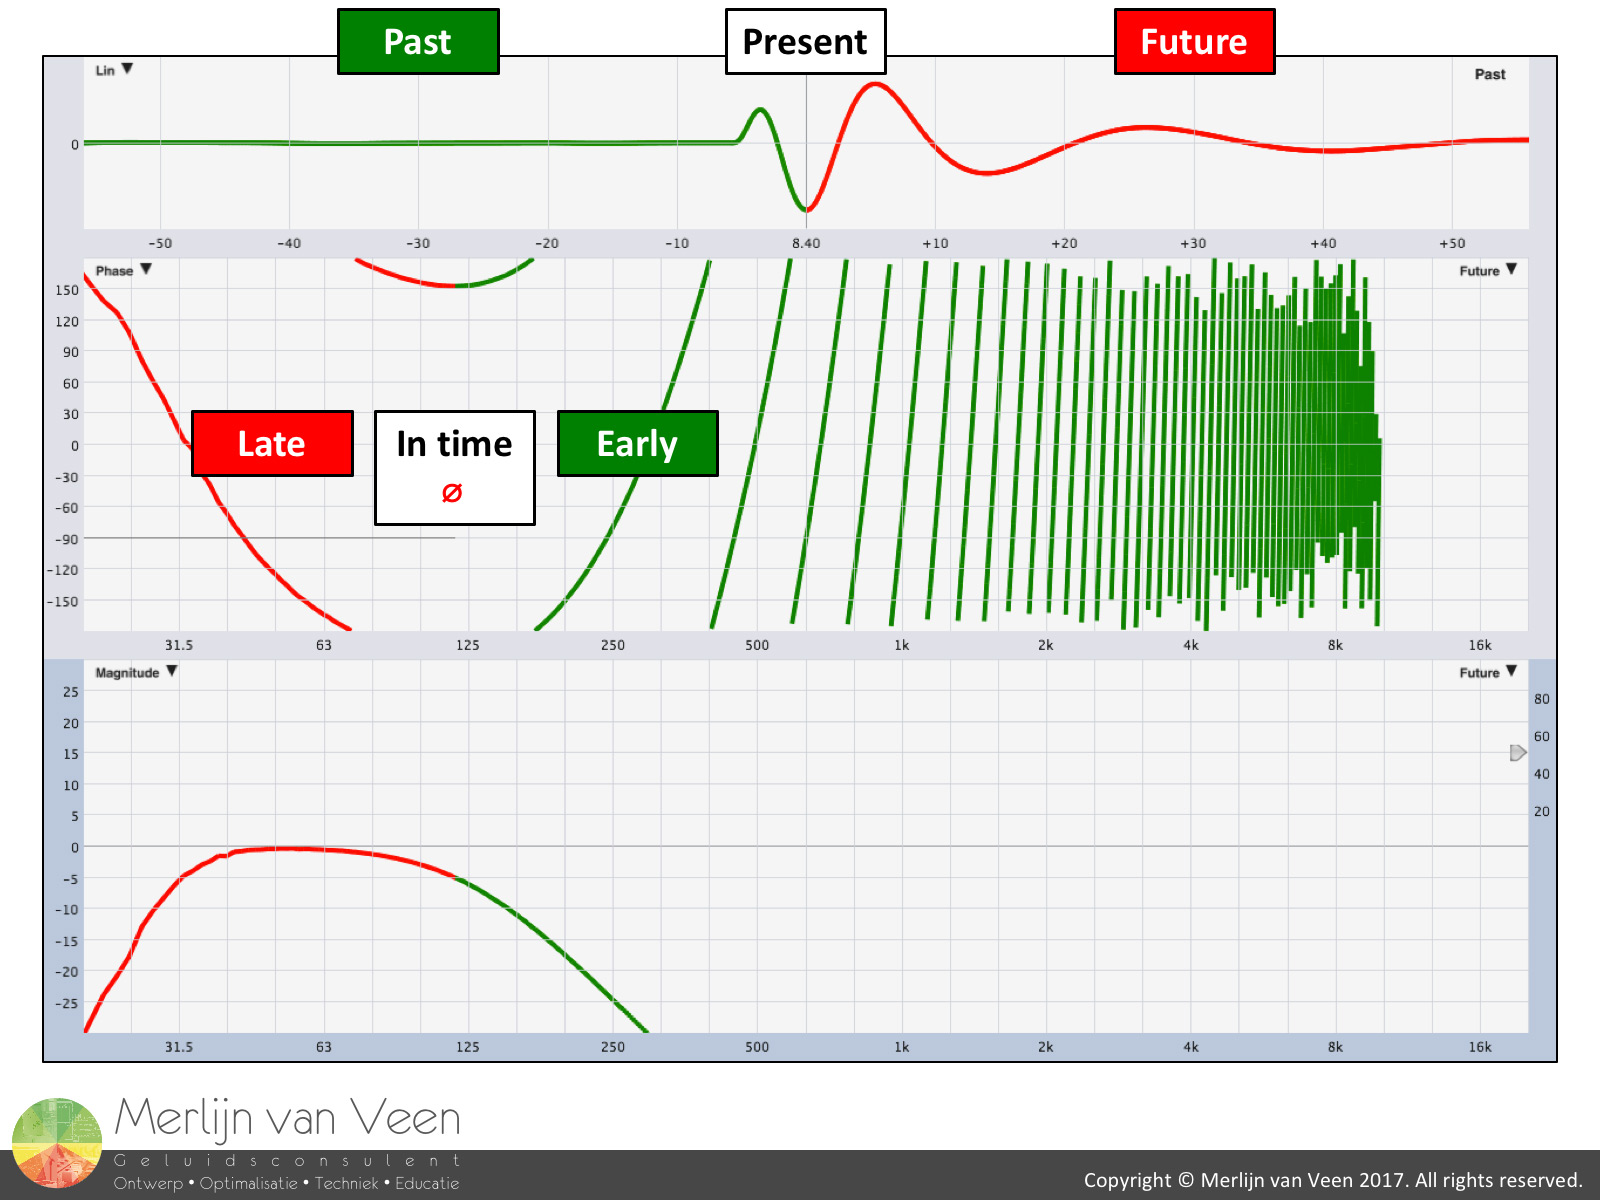
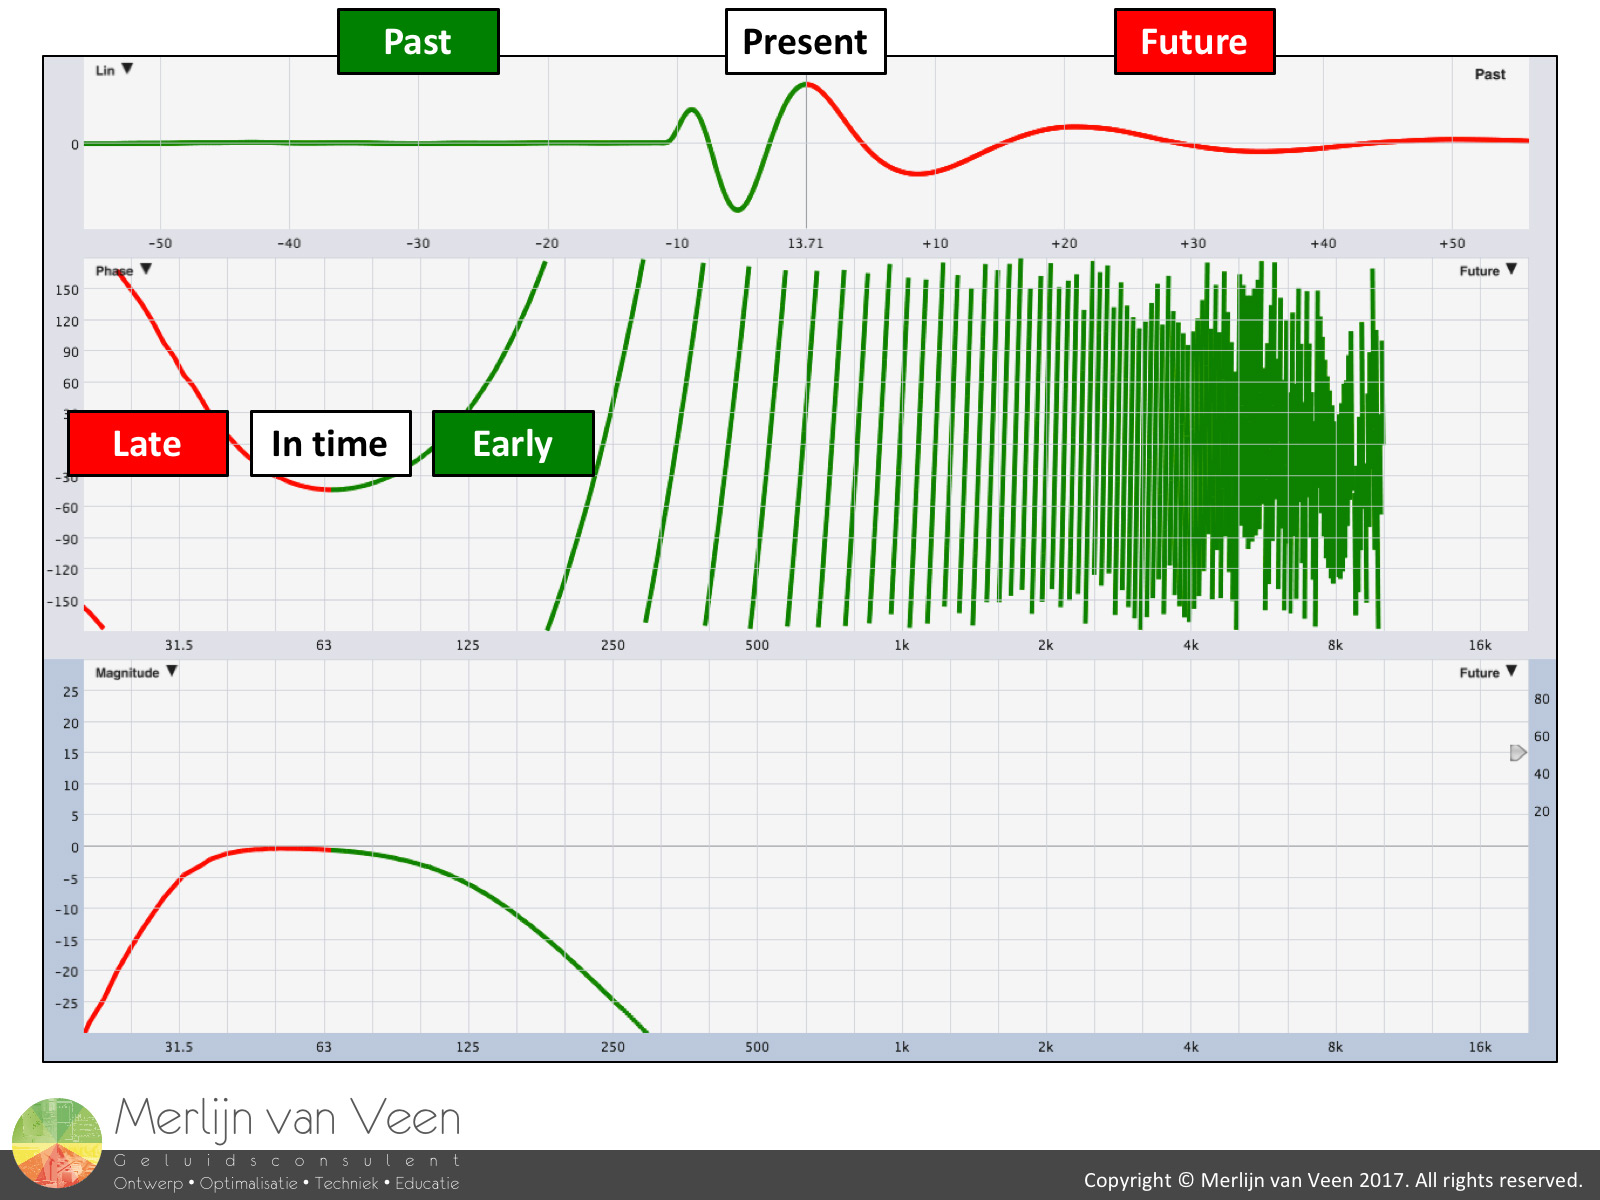
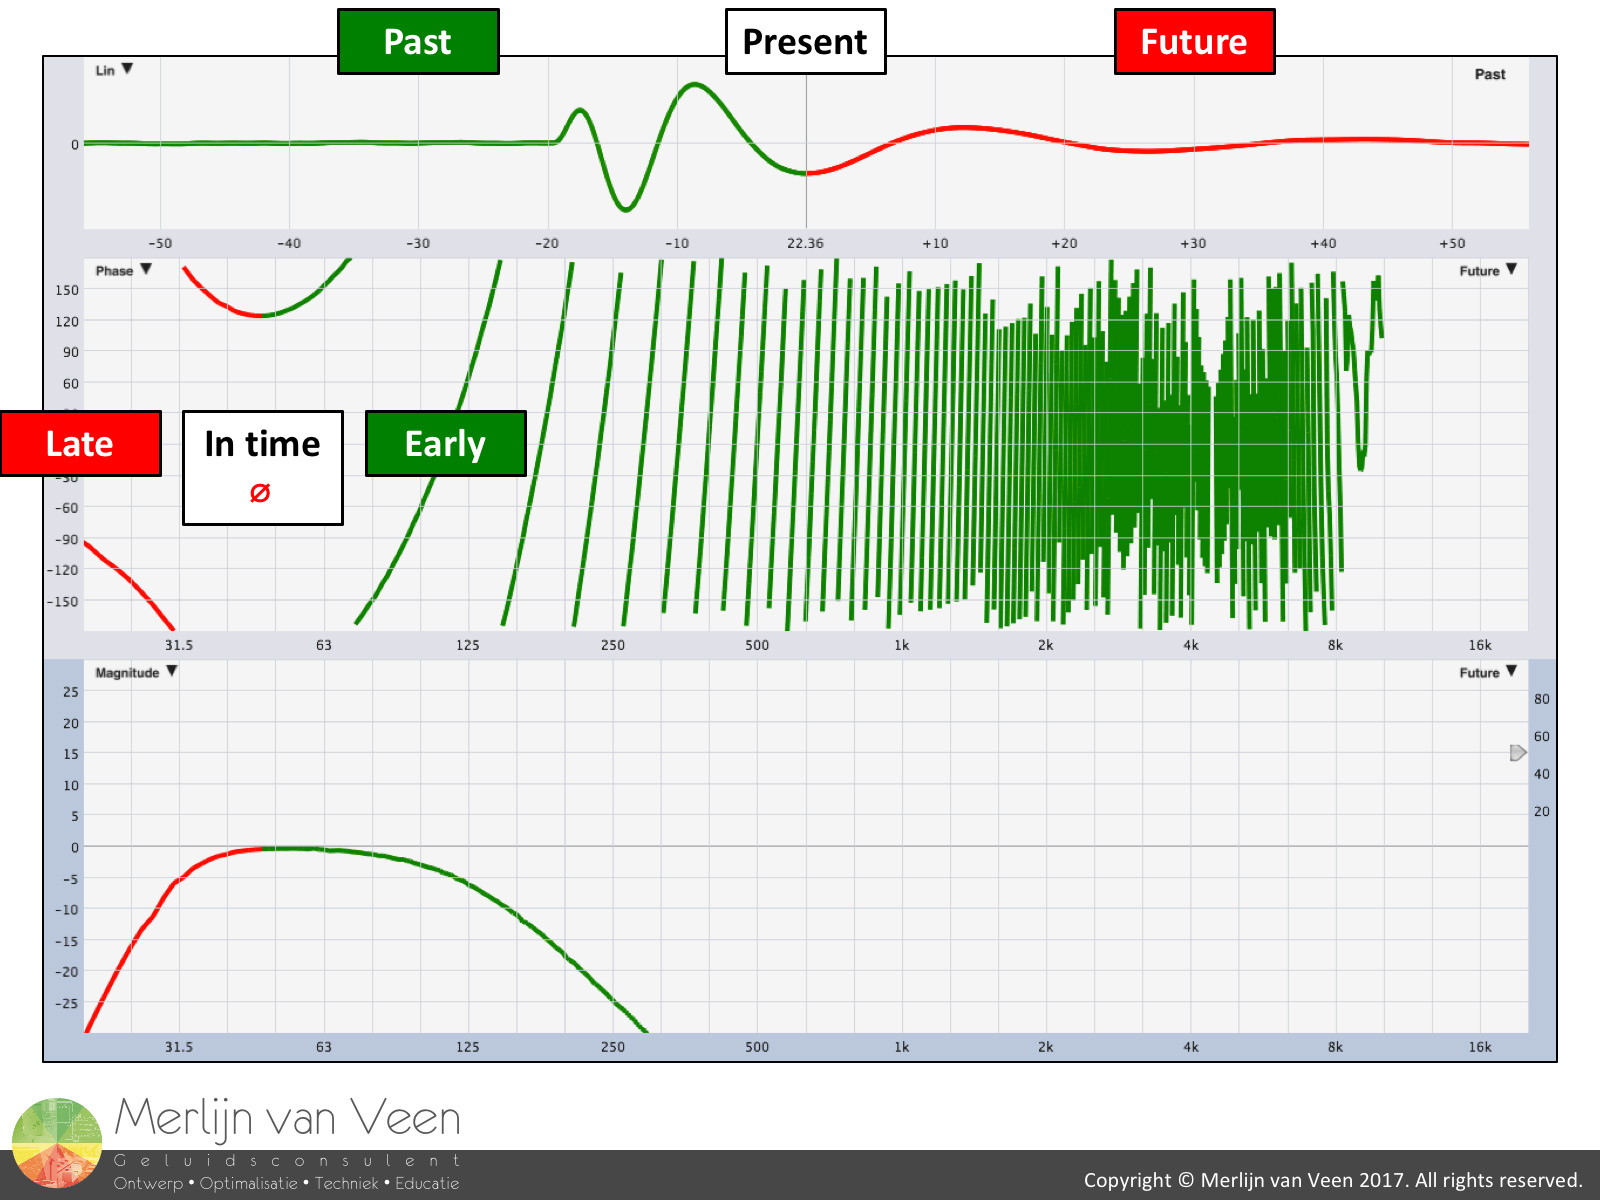
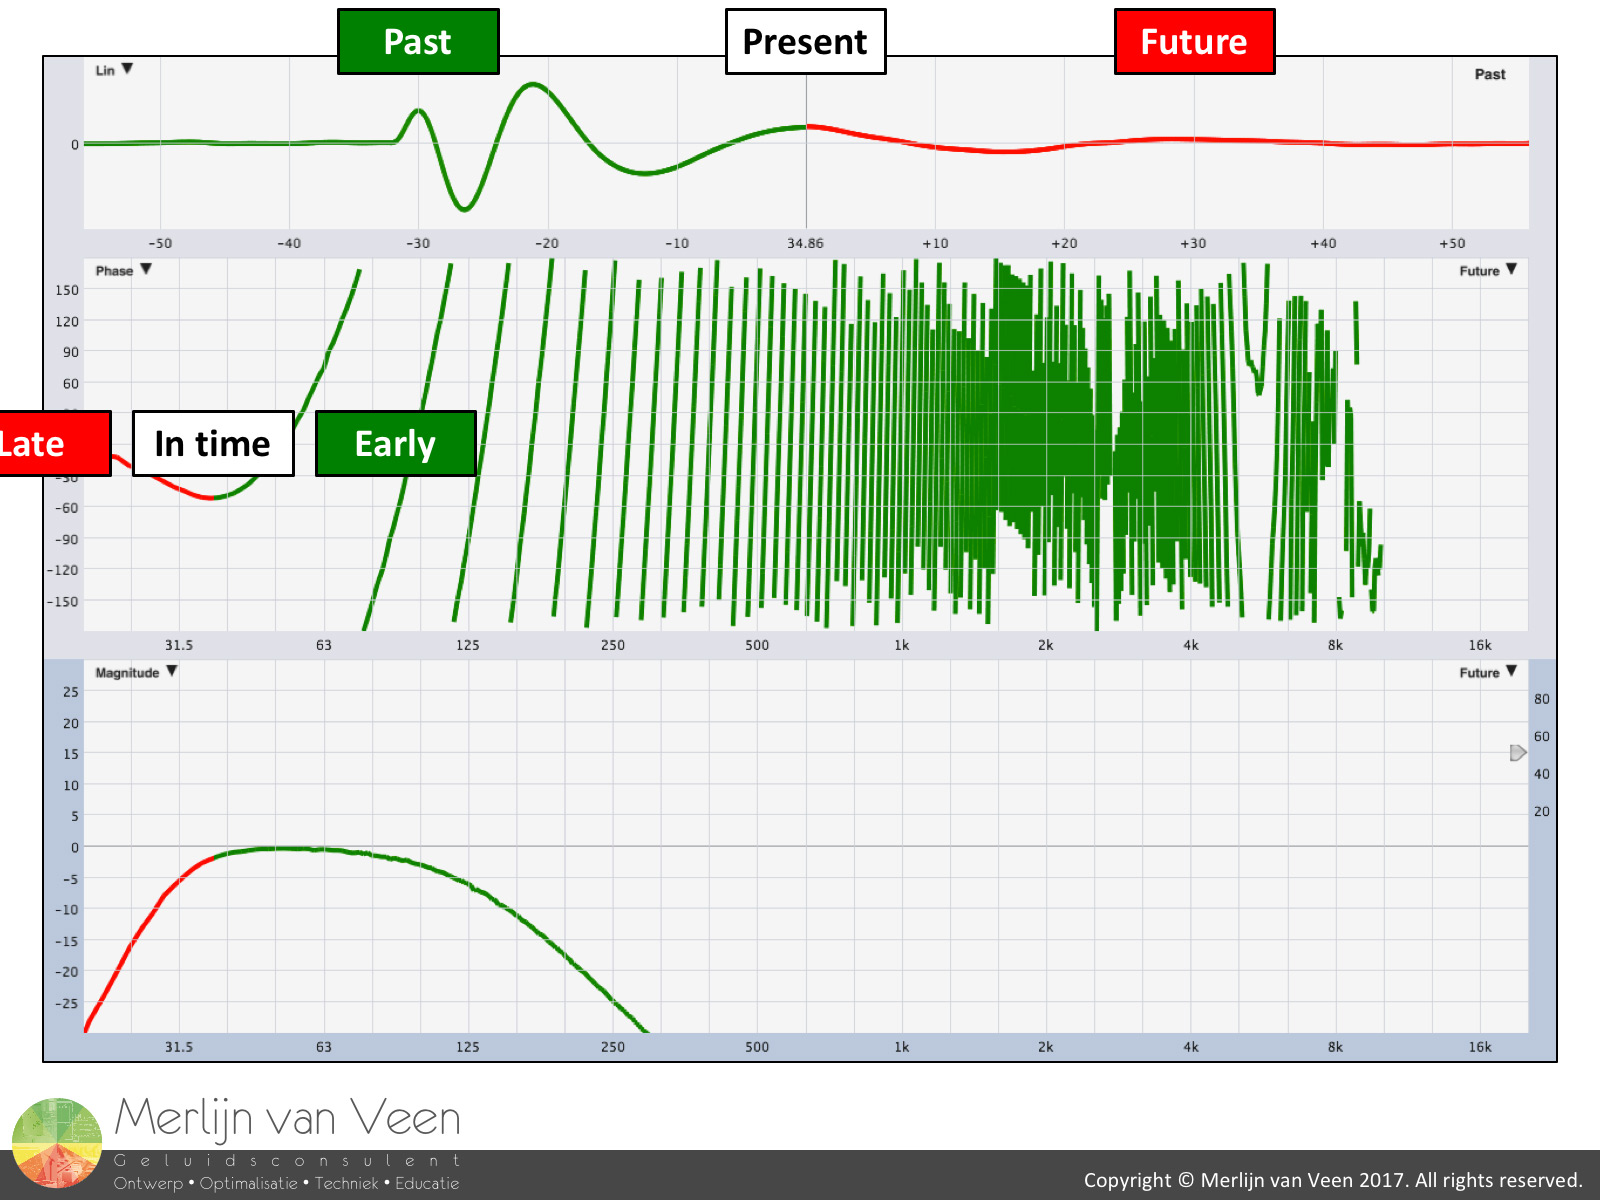 Real loudspeakers are very likely to exhibit some degree of phase shift in their frequency response. Negative slopes in a phase trace indicate frequencies arriving late with respect to the reference signal, positive slopes indicate frequencies arriving early and no slope (horizontal tangent) indicates frequencies arriving in time with the reference signal (figure 6).
These trends are not limited to any particular part of the frequency spectrum. More slope (regardless whether it's negative or positive) for the same frequency range means more time offset, less slope means less time offset.
In gallery 1 we “scrub” with the delay locator of an analyzer through the IR of a subwoofer. If you literally think of its IR as a track in a DAW (figure 3) then depending on our current playback position (present), some frequencies we’ll already have heard (to the left of our current playback position = past) whereas the remaining frequencies (to the right of our current playback position = future) we yet need to hear.
As you can see, this "song" takes time and the phase response which describes time over frequency, confirms this. Otherwise it would be ruler-flat like a microphone cable (without any phase shift). Regardless of where we are in the song, there's no visible range of phase trace without a change in slope. Only at a bending point, from negative to positive slope or vice versa, is the tangent horizontal. Here we observe a very narrow frequency span where measurement (output) and reference (input) are in sync.
In addition, the IR clearly shows that polarity is a moving target. The oscilloscope or DAW shows Alternating Current with alternating polarity. Some frequencies are in phase whereas others are out of phase. However, this does not affect important decisions regarding, e.g., crossover alignment. In such cases, the critical factor is matched phase responses in the overlapping region.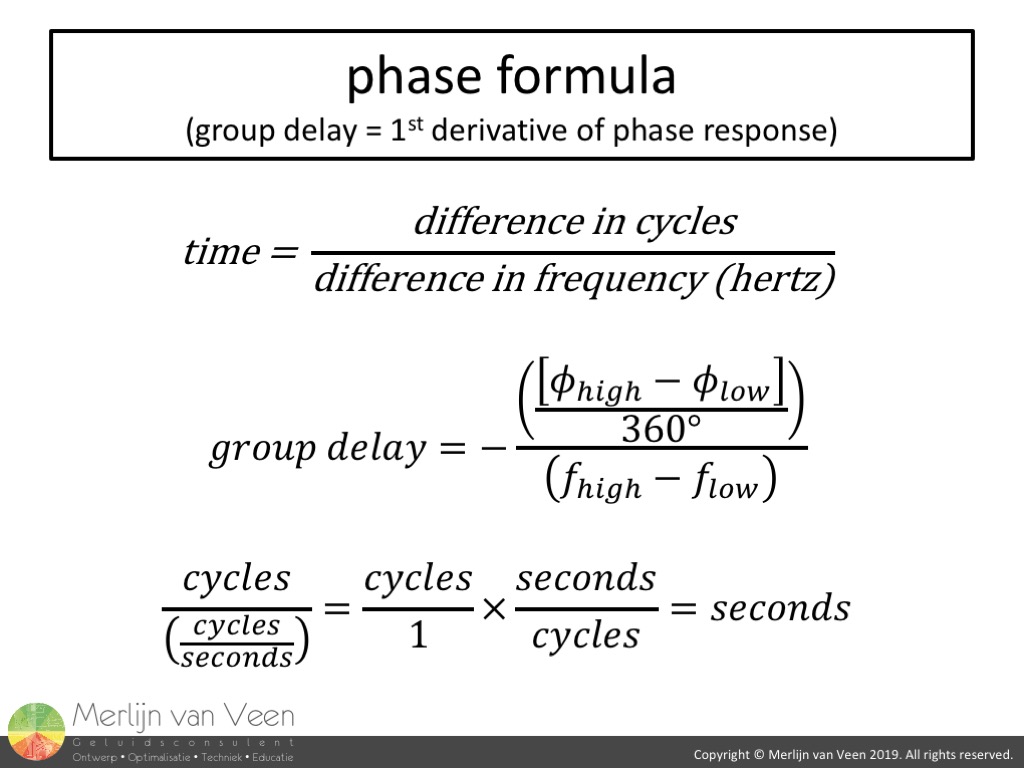 figure 7
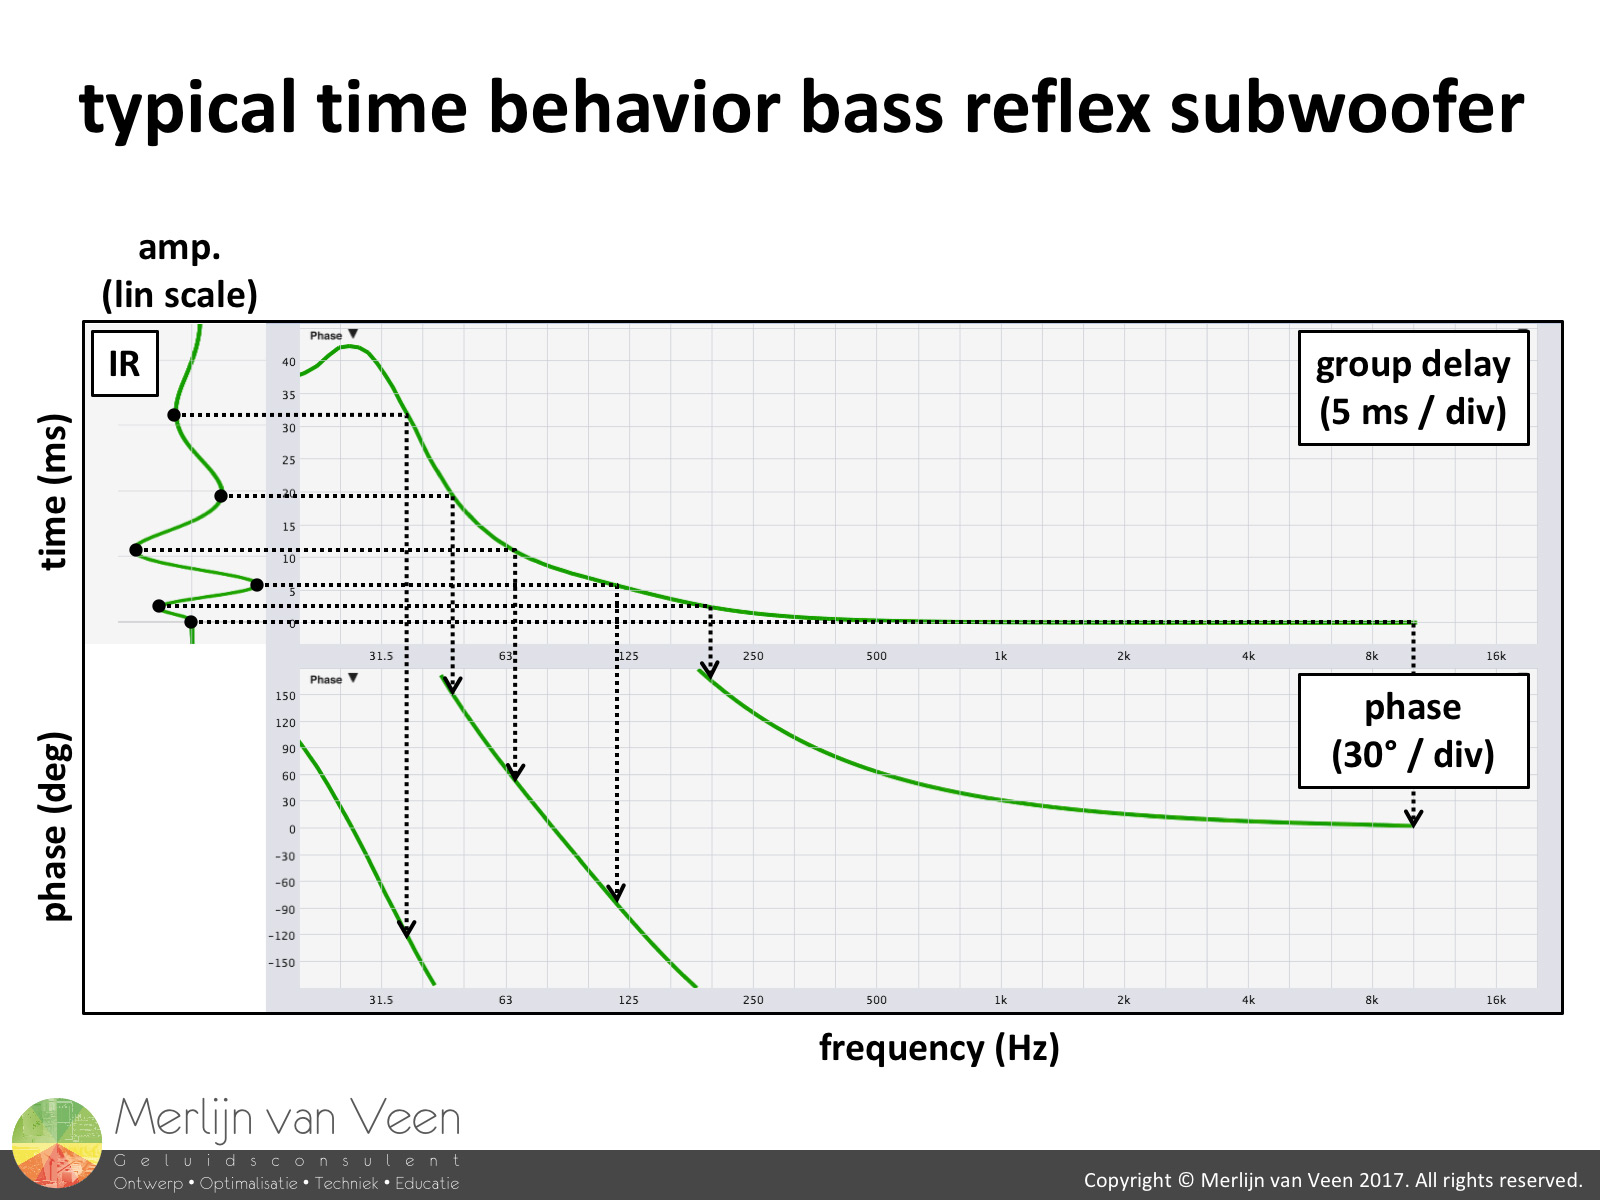 figure 8
 figure 9From a loudspeaker's phase response we can calculate group delay. Group delay is complex math. It is the first derivative of the phase response (figure 7). You can simplify it (but very badly, I warn you) by visualizing it as frequency dependent delay which I don't define and is inaccurate anyway. Strictly speaking, group delay is the time delay of the amplitude envelopes of the various sinusoidal components.
Figure 8 shows common ways of observing time in an analyzer. For the subwoofer in this article, this particular arrangement enables us to estimate at best, the way from IR (time domain) via group delay to phase response (frequency domain) and back. Our "song" begins at the very high frequencies with 0 ms and ends around 40 ms (14 m / 45 ft) later at 31 Hz!
Now please remain calm! Just because I slapped a number on it, there’s no reason to panic. You might have been aware of phase shift and group delay but, until today, very few of you ever considered it a problem :-)
For more information please watch the accompanying video shown below.
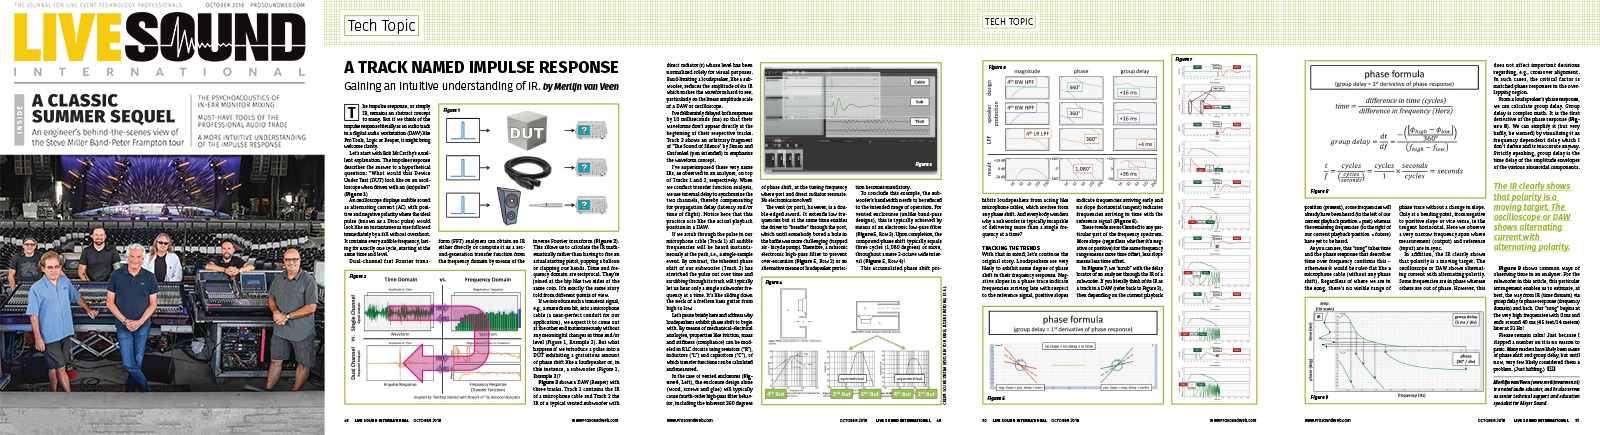 This article is also featured in the October 2018 issue of Live Sound International magazine.